By TTT subscriber Andrew Beasley. Stats sourced from EPLIndex.
I wrote a piece earlier in the season about how the majority of opposition keepers had been made to work harder against Liverpool than was the norm for their seasons otherwise, and that most of them saved a higher percentage of the shots faced when up against the Reds too.
The issue with that article however was that there was no context of where in the goal the shots went. Were they straight at the keeper or in the corner, high up or low down?
Thanks to the Opta data on EPLIndex, I can now demonstrate exactly that information, and hopefully (or should that be ‘unfortunately’) show that Liverpool’s shot placement is also partly responsible for their low scoring rate this season, and not just because “their keeper done a worldy there, Jeff”, as Paul Merson likes to spew forth at any available opportunity on a Saturday afternoon.
The goal is divided into six sections, with information given about how many goals and shots have been hit in each. Here are Liverpool’s current goal and shot placement diagrams:

Bear in mind that own-goals are not included in the figures (presumably as own goals are usually only awarded if the original shot was off-target).
We can therefore see, for example, that two goals from seven shots on target have been scored in the top left corner of the goal, seven from twenty-seven in the bottom left corner, and so on. I have no doubt that Damien Comolli and his team have this information in far greater detail, but these numbers can still help us to analyse where Liverpool have been going wrong shot-wise with greater accuracy than has been attempted previously.
I have collated the data for every club to have played in the Premier League from 2008/09 to the present. In short, the analysis covers 3,621 goals from 12,736 shots on target across 1,390 matches (or 2,085 hours of football if you prefer), so I think it’s safe to say that any statistical anomalies should have been ironed out. Let’s take a look at the total figures:

What we can see is that the highest percentage of shots go towards the low-centre of the goal, but that this is also the area with the lowest conversion rate; this stands to reason, as most of the time that is where the goalkeeper will be stood when a shot heads towards his goal.
Conversely, the top-left sector sees the fewest shots but the highest conversion percentage; closely followed by the top right-hand corner: right on the proverbial postage stamp. These areas are harder to hit, but more rewarding.
Logically, the likes of Liverpool and the other top sides have better strikers than the teams at the bottom of the division, as they score more goals. How do the figures for just the ‘big six’ teams over this period compare?

The interesting thing to notice is that whilst the conversion rates are higher (a total 30.7% conversion rate, as opposed to 28.4% for the league overall), the percentage of shots in the different areas of the goal are all basically same; none is more than 0.4% different from the league average. It therefore appears that the placement figures are fairly consistent throughout the league.
So far this season, Liverpool have scored a paltry 1.16 goals per league game, which is comfortably their worst return in the Premier League era (though interestingly, their last season with a worse figure was the last season of the old Division One, when they averaged just 1.12 goals per game). I’ve previously established that opposing ‘keepers have appeared to have played well, but have the Reds made it relatively easy for them? Here are Liverpool’s figures for this season:

It’s no surprise that the conversion figures are below the league averages in view of the poor goal return, with the top-right sector of the goal being the worst offender with only a 12.5% conversion rate; very poor compared to that area’s average of 40.5% across this whole study. This suggests that keepers have been making some spectacular saves, right in the postage stamp.
The real interest comes in the placement itself; Liverpool have placed 41.5% of their shots into the two central sectors of the goal (where the lowest goal conversion generally occurs) compared to the league average of 37.8%.
Essentially one-in-three of Liverpool’s shots on target have been to the low-centre section of the goal, yet this is where the lowest percentage of goals have been scored across the last four seasons in the Premier League.
Is the figure of 32.9% of Liverpool’s shots heading low-centre significant? Only 12 of the other 79 ‘team seasons’ studied here placed a higher percentage of their shots into that area of the goal, and when we look at the figures for the four highest scoring teams from each of the four seasons covered here, it becomes apparent that this may be where Liverpool’s problems lie.
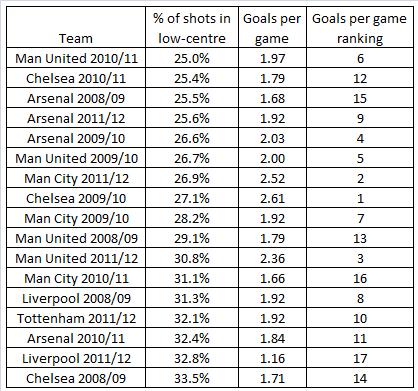
Whilst there might only be a vague correlation between goals per game and the percentage of shots to the low-centre of the goal, it does appear that the top scoring teams do vary their shot placement more than Liverpool have been of late; seven of the top eight scoring teams on this list found this area of the goal with a lower percentage of their shots than the average for the league for instance, yet the Reds are currently 3.8% above it.
So who is to blame? As 81% of Liverpool’s shots-on-target have gone to the bottom half of the goal, I have focused on that area to see which of the Reds’ players have been shooting too close to the keeper.
[PT: although, of course, there will be situations where shooting under the keeper’s body, such as when he is rushing out to the attacker’s feet, is the only option; plus, it makes sense when faced with an open goal to shoot as low and centrally as possible, to minimise the risks of missing. But these are more likely to be fairly rare occurrences.]
Where a box is highlighted green, that is purely to indicate that the player has scored with all of his shots into that particular area of the goal, as a point of interest.
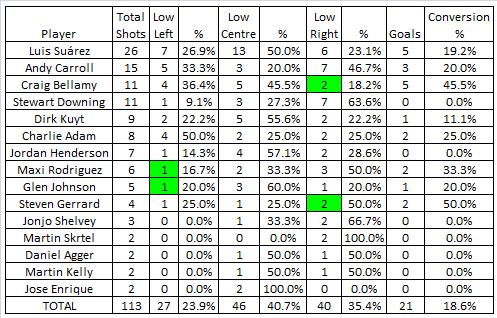 No surprise to see that Luis Suárez has had more shots on target than any other Reds player as he has played more minutes than any of the club’s other strikers, even allowing for his recent bans that you may just have heard something about.
But he has also put as many shots into the centre of the goal as the other three main forwards at the club combined, and this has surely contributed to his relatively low conversion rate; indeed, only two of the Uruguayan’s 13 shots into the low-centre sector have resulted in goals.
Some credit has to go to Andy Carroll therefore, as he has the lowest figure percentage-wise for the centre of the goal of any of the recognised attackers (sorry Mr Skrtel, you’re really more of a defender by trade). Carroll appears to be the forward making the most effort to place his shots into the corners of the goal and beyond the reach of the keeper.
[PT: the risk for this being that, in aiming for the corners, you only have one direction of leeway – inside the post. By contrast, if you shoot centrally, you’ll almost certainly hit the target, but also risk hitting the keeper – the Djibril Cissé/Emile Heskey school of finishing: hard and low, and central. Andrew’s stats seem to show that Carroll is thinking about his finishing, rather than just hitting and hoping. Another sign of encouragement, from a player coming into form, and whose cup goal against Brighton was swept into the bottom corner.]
Considering that Carroll’s overall shots on target ratio (39.1%) is only a small margin behind that of Luis Suárez (41.7%), and that he is similarly close with his shot conversion rate (6.5% vs 8.3%) then a case could be made that the Geordie has been virtually as effective as his South American partner, in purely goal getting terms at least.
With such a good defence at one end of the pitch (the second best in the division at the time of writing), it is frustrating that Liverpool have not made the most of their opportunities at the other, and I hope this article helps in some part to explain why. Now, if someone can find some shot speed and power statistics, then I might really start to analyse where the Reds are going wrong.
Subscribe to TTT to discuss this article with Andrew and other discerning Reds.
