This series of articles features visualisations, with screen shots of various dashboards. However, links will be provided to the dashboards in the section headings if you want to access their interactive features. Statistics correct as at 16th December 2019.
With Liverpool free from Premier League commitments for a couple of weeks, it seemed the perfect time to update the spreadsheets, charts, graphs and dashboards, and see how the Reds have been getting on in the last couple of months since our previous round up.
When that was compiled Liverpool hadn’t yet dropped a league point this season, so they’ve clearly struggled in the last couple of months. As if; top of the league by a decent margin and into the last 16 of the Champions League. You don’t have to go too far back in time to when such things were unimaginable, the stuff of dreams and fantasy.
As always, we have to try to assess how much of the success this season has been merited, so let’s take a look.
Expected goals (interactive version)
Our previous data viz collection went up to the home win over Leicester. In the league and Europe since then, Liverpool have picked up 11 wins and two draws from the 13 matches they’ve contested. It’s a stunning run of form, but let’s see if it was deserved.
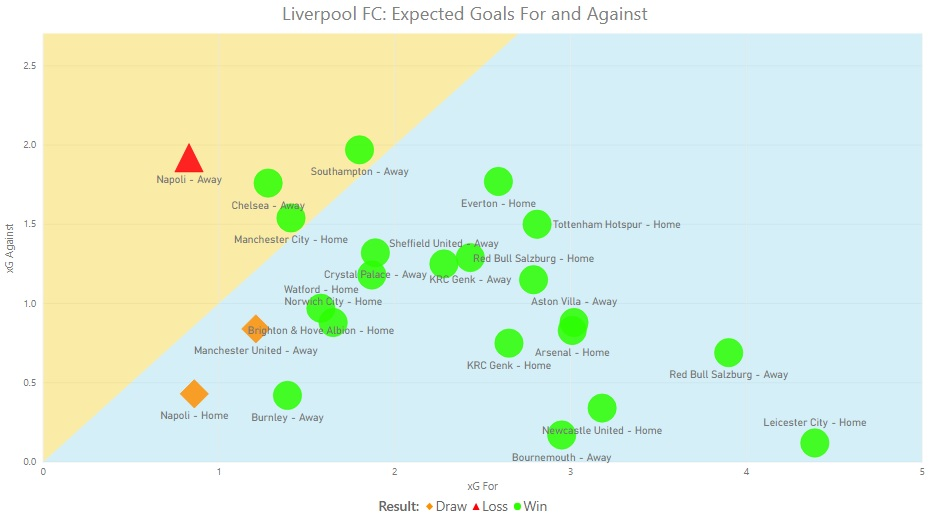
Since last we met, just one result was deemed as unmerited, if you assume an expected goal difference of greater than 0.5 warrants a win: Liverpool’s 3-1 victory over Manchester City. Your heart bleeds, doesn’t it? How many times have the Reds got a result their performance didn’t deserve against City in the last two seasons at Anfield, Pep? Twice, you say? Twice? Interesting.
The total for the season is now 63 points in the two main competitions, from performances that were worthy of 57. From 23 fixtures, three draws on the xG stats became wins in reality, we’re not talking daylight robbery here. But were the Reds given a boost by the officials at Stockley Park?
VAR Stats
I have tried compiling statistics on the use of VAR in the Premier League, but it’s a minefield. Different websites list different incidents, including (or not) standard checks as well as the more unusual ones. Nobody seems to know definitively how many checks take place.
However, Dale Johnson of ESPN seems to be doing the best job of anyone when it comes to collating it all. By his count there have been forty-five goals, penalties or red card incidents which have been overturned by the video referee. I thought it’d be interesting to see who has had the most helping hands, or had to take the most punishment.
It’s important to bear in mind these stats don’t work along ‘for and against’ lines in the strictest sense of goals scored and conceded. If a goal your team scores is initially disallowed but overturned by the VAR, that’s in your favour. But so is a goal you concede which is then disallowed by the VAR following a review (the Wolves match, in other words!)
The decisions are therefore split into being in favour of a team, or in favour of their opponents, with which end of the pitch it occurs at irrelevant here.
That’s about as clear as most usage of VAR, but hopefully it makes a bit of sense. While there are decisions which affect penalties and red cards, we’re going to focus solely on goals here to keep things relatively simple.
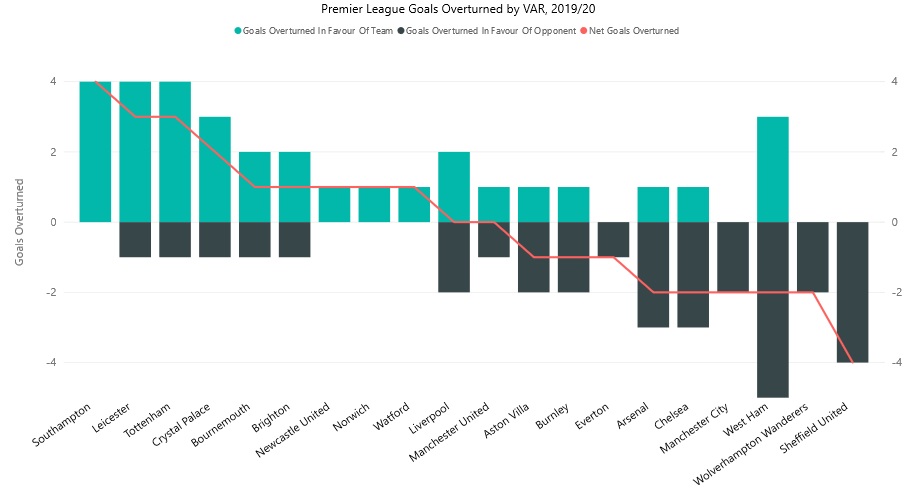
Liverpool are right in the centre of the chart, as their net gain is zero. Disallowed goals for Cesar Azpilicueta and James Tomkins have been balanced off by two Sadio Mané goals (against Manchester United and Watford) which were struck off. Remember: these are goals overturned by VAR, so Firmino’s armpit goal isn’t included as it was disallowed on the pitch, not by the Stockley Park crew.
It would be interesting to try to assign points won or lost to this, but of course it would all be speculative. In Liverpool’s case, Azpilicueta and Mané’s goal at Old Trafford broadly balance out, in that they were both first half equalisers in big games. That leaves the former Saint’s goal against Watford which didn’t have much effect on the final result, and Tomkins’ goal for Palace which might have. It doesn’t look like VAR is ensuring Liverpool win the league, though, does it?
Postscript, 30th December: With games every few days, these articles unfortunately go out of date between when they’re written and when they’re published! But obviously we have to mention the 1-0 win over Wolves, as Liverpool benefited from two VAR decisions, with their disallowed goal being awarded and Wolves’ ‘goal’ overturned. It could be argued it was a match in which VAR earned Liverpool points, though they’d have still had an expected goal advantage of around one based on the shots both teams had.
Expected goal involvement (interactive)
We’ve previously looked into the concept of Liverpool having a front five, and – oh boy – doesn’t this chart of players responsible for expected goals and assists really hammer it home.
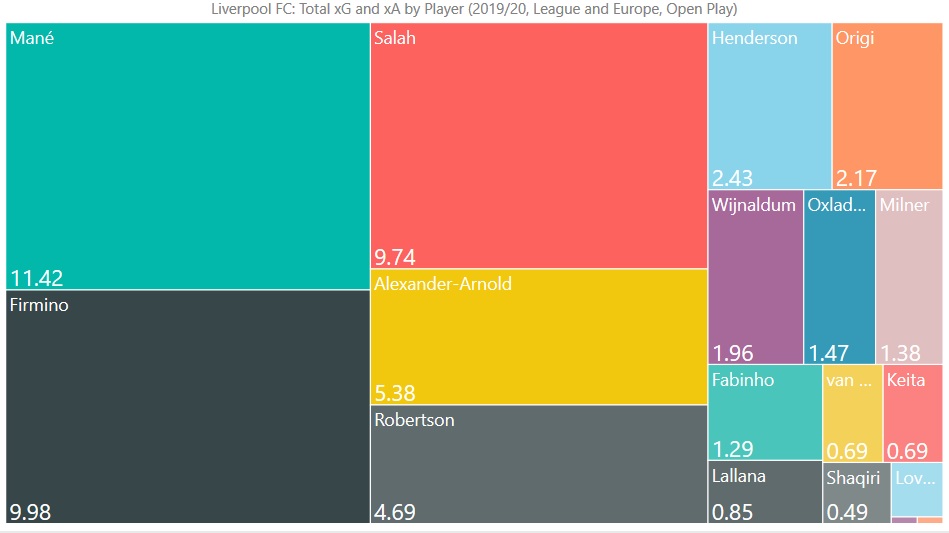
The leading quintet account for three-quarters of the involvement in the team. In the previous data viz article, Sadio Mané was in third place, and I noted:
It’s Firmino on top, who – just – leads the way from Salah. However, on a per 90 minutes played basis, Sadio Mané is closer to them than he appears here, due to featuring for less time.
Liverpool’s number 10 has maintained his pro-rata edge and now played more minutes too, so he takes his rightful place at the top of the pile. He really has become the Reds’ key man in 2019, and this is ample evidence of that. Let’s see which duos have linked up to create the most xG.
Expected goals by combination (interactive)
We’ve more than doubled our sample from 10 games in league and Europe in the last round up to 23 in this. But our selection of chance creating combinations with at least three chances under their belts has only grown from 14 to 24, suggesting the main link-ups shown here will be the key ones for the rest of this season. That said, there is one duo who have come from nowhere to take a prominent spot on the chart.
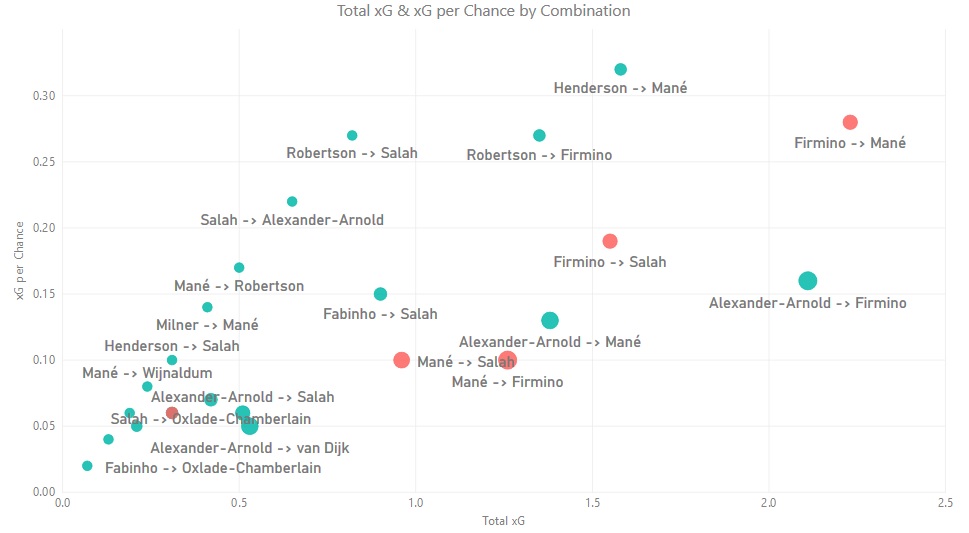
Jordan Henderson has created five chances for Mané in 2019/20, with four of them being deemed as clear-cut opportunities by Opta. Back in 2014/15, Hendo linked up extremely well with Raheem Sterling, and it appears that relationship has effectively been reignited with Mané.
Last time out the lack of ‘Salah -> Mané’ was noted, and they’re absent once again. However, there has been one chance created now, and it was a beauty; Salah assisted his Senegalese counterpart for a goal at Genk. With an xG value of 0.36, it was the joint 21st most valuable of the 240 chances Liverpool have created this season. More please, gents.
Liverpool’s progress under Jürgen Klopp
If you’re a user of social media, you will almost certainly have seen an animated bar chart. They were a data visualisation fad in 2019. I wondered how one could be applied to chart Liverpool’s progress under Jürgen Klopp, and I came up with this.
The below chart shows the points totals over the previous 38 league games for England’s biggest six clubs. Since Klopp’s first match, there have been 124 batches of 38 matches, and this shows how the totals have fluctuated for each team between batch one (from game nine of 2015/16 through to game eight of 2016/17) through to the present day.
Please note: this visualisation has a mandatory autoplay setting, so by the time you’ve got this far into the article it has probably reached the end. Either refresh the page, or hover your mouse over the top right corner of the viz until a little square appears. It should say ‘focus mode’, so click that and the animation will start again.
There are lots of points of interest in this. For starters, it illustrates beautifully how Leicester City were able to win the title in 2015/16, as none of the top clubs were even averaging two points per game when the animation starts.
There’s much jostling for position before Chelsea become the first team to truly stretch ahead at the top, when Antonio Conte came in and drove the Blues to the title in his debut campaign. Manchester City then usurp them, with Liverpool trying to keep pace. I hadn’t realised the Reds actually overtook the Citizens on this for a couple of games at the end of 2018. That would’ve been a sign that Liverpool growing to dominate this chart wasn’t beyond the realms of possibility.
However, perhaps my favourite things which are noticeable on this chart is that Liverpool are top by a clear margin now, and Manchester United are the only one of the six teams never to lead this particular race. You can’t ask for much more than that, can you?