
By now you will have heard all the stats about the Reds’ best start to a season for years, coupled with a very tough set of fixtures to contend with – especially since the first international break. On this very site earlier in the week we had this by Paul looking at a variety of topics including the randomness of trophies, the cost of each rival squad, and the Ratings Performance Index. Then yesterday Beez wrote this, which touched on the team, but as you will see has some amazing visualisations for the players’ individual performances in each game and across the season. Finally, you may also have come across a system for evaluating teams called SCoRe – created by the head of analysis for Gracenote Sports, Simon Gleave – which looks back at the exact same fixtures from the previous season and compares the results.
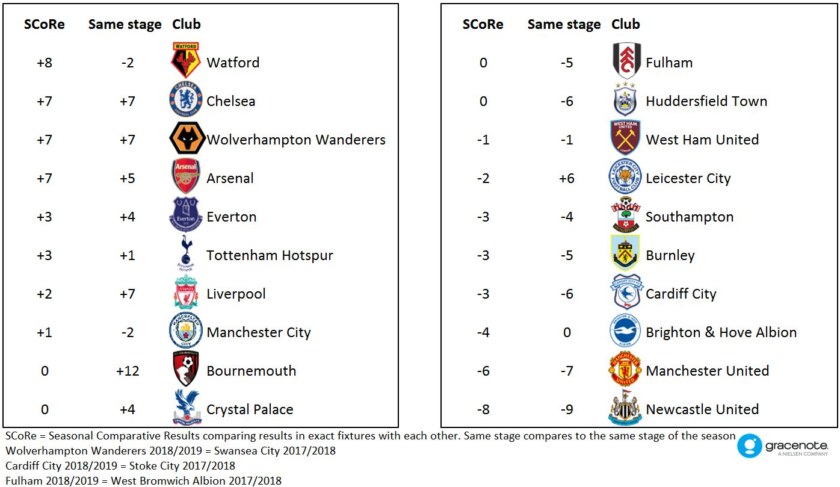
The Reds are seven points better off compared to the exact stage last season (after eight games) but when comparing the same fixtures that figure drops to two points. Some other notable improvements, which is fairly annoying, are Chelsea (+7), Arsenal (+7), Tottenham (+3) and even Manchester City – who set a record points total in 2017/18 – and are one point up on the same set of fixtures!
What this analysis sets out to do is look at the exact same fixtures, but go back three seasons to Klopp’s first full season in charge and see what, if anything, has improved over time.
The rest of this article is for subscribers only.
[ttt-subscribe-article]