Given the recent anniversary of a certain gregarious German being appointed Liverpool manager, I thought it was time to present, in a free-to-read piece, a few facts and snippets of analysis, in response to some of the reactions to the Man City draw; but also to bring focus – and full context – to the overall body of work Jürgen Klopp has delivered.
As ever with our free pieces, feel free to share if you enjoy it (although it’s the subscriber/paywall model that we mostly focus on now, as that’s what pays all of our bills.)
Trophies Are Random
Cup football is notoriously random; the very premise centres around the possibility of being drawn against top teams, average teams or terrible teams (although the Champions League generally weeds out the weaker teams).
By contrast, aside from Leicester City, the top end of the Premier League is far from random, and determined in no small part by having a big budget: won every single season since 2004 by one of the three richest clubs in the land, based on their £XI (the average costs of all of their 38 league line-ups, adjusted for Transfer Price Index football inflation; more on that later).
So far Klopp has taken Liverpool to two European finals and one domestic final; losing all three, but one was on the most random of random cup outcomes (which Liverpool have of course benefited from in the past), the penalty shootout; while the two European finals pitted the Reds against the Spanish team who in recent times always won that particular trophy.
In the league Klopp has not had one of the top three budgets (either £XI or wage bill), and even now, Liverpool only rank 4th on the £XI score, a long distance behind Manchester City, Manchester United and Chelsea, but ahead of Spurs and Arsenal.
Was Gérard Houllier a genius and Klopp a muppet because Houllier’s Liverpool beat lowly Birmingham City on penalties after a 1-1 draw in 2001 and Klopp’s team lost the shootout in the same competition against possibly the best, and joint-richest, side in England?
We all talk of the miracle of Istanbul, but even that (after a monstrous second-half effort) was won randomly with spot-kicks, while Liverpool outplayed AC Milan two years later and effectively lost to a (random) deflected goal. In one-off games, randomness happens: including a mixture of judo, karate and goalkeeping gaffes in Kiev, to deny Klopp a trophy he arguably deserved on the amount of goals the Reds scored (a new competition record). But that’s cup football: you don’t always get what you deserve. (If football was fair, Sergio Ramos, after umpteen acts of shitbaggery up to that point, would have had to give up football in 2013 due to being anally impaled on a corner flag, or some such other karmic justice.)
And to be frank, Klopp has been right royally rogered in the domestic cup draws lately. Apparently Liverpool got ‘lucky’ in the Champions League last season by facing no one of an elite standard in the knockouts – other than Man City (and Real Madrid in the final, too) – although Porto and Roma, while not elite, were not exactly mugs. Roma in the semi-final was a fortunate draw, given that it was the semis, but there were worse teams than Porto to be paired with in the last 16. And if the one favourable tie was Roma in the semis, that luck only came about months after overcoming a good German side in the playoffs. (The group stage was fairly routine, however.)
Last season Liverpool were handed Leicester, Everton and West Brom (freed from their league worries and suddenly fighting) in the domestic cups, and this season, so far, it’s been Chelsea. So that’s essentially four additional Premier League games, and no easy lower division opposition. How often do clubs draw Premier League opposition four times in a row in the early rounds of competitions?
This will also affect a manager’s win-%, given that, say, four or five wins a season in the domestic cups against lower league opposition could really bump those figures; just as a good win-% in the Europa League is not as impressive as having the exact same win-% in the Champions League.
Unlike his predecessor, for example, Klopp is managing a far greater number of his European games against top sides, not Europa League flotsam. (And even Klopp’s run to the Europa League final involved knockout games against Man United, Borussia Dortmund and Villarreal, who were more like Champions League teams; while last season’s Champions League qualifying round, against Hoffenheim, was not a ‘gimme’ like Qarabag – Hoffenheim are now indeed themselves a Champions League team.)
This is not making excuses for Klopp – simply pointing out that, aside from the domestic games in 2016/17, he’s not really had much luck in the draws of the cup, with this season’s Champions League group another example of what have not exactly been favourable situations. So, “he must win trophies” is utterly nonsensical to me.
What was Roy Evans’ best Liverpool side? For me, 1995/96. But no trophy; just a late-lost FA Cup final against Man United. A weaker Liverpool team the year before beat lower-tier Bolton in the League Cup final. Worse team, but a trophy, due to much worse opposition.
What was Rafa Benitez’s best Liverpool side? Without doubt, 2008/09, with only two defeats in the league and making it to the quarter-finals of the Champions League, including a 5-0 aggregate thrashing of Real Madrid. But nothing won that year. It was a far better team than in 2005 or 2006, but the randomness of penalties gained a trophy both those times, with the games themselves taken to penalties by some speculative late long-shooting that on other days goes miles wide (ditto on goals to reach those finals).
For me, Gérard Houllier’s best team and squad was 2001/02, when the Reds finished 2nd in the league with 80 points and reached the quarter-finals of the Champions League/European Cup for the first time in almost 20 years. Obviously the season before ended with three trophies, and you could perhaps argue here that the treble-winning side was better because of that, but even if you make that call, the contrast between three trophies and no trophies had zero to do with the difference in quality of the two teams. Houllier’s next team, 2002/03, was dire to watch and the wheels came off in the league, with some terrible summer additions. But they won a trophy. Lovely at the time, but utterly meaningless in terms of the progress and general health of the club. Despite beating Man United in the final, I couldn’t give two shits about that team. It has no place in my heart, made no dent on my soul. Indeed, I try my best to forget some of those players.
Liverpool’s 2013/14 side was indubitably better than the one of 2011/12, when reaching two cup finals and winning the League Cup; and 2013/14 was better than Houllier’s 2003 side, that also won the League Cup, and Evans’ 1995 side, that won the same trophy. (If this doesn’t show the randomness of trophies, then just look at how Arsenal had to win some after years of drought under Arsene Wenger, then, when they won some, no one cared. In that time, Spurs won nothing but were objectively better.)
With Daniel Sturridge’s recent resurgence I’ve heard a lot of talk from neutrals (on various media podcasts) about the thrilling Sturridge/Suarez/Sterling/Coutinho/Gerrard combinations from 2013/14, and they had a point; but I never hear effusive memories of 2011/12, 2002/03 and 1994/95; and even the 2001 win over Birmingham is only remembered in the broader context of what followed.
These resulted in great days out, but they weren’t even indicative of the best of those managers’ reigns, with Kenny Dalglish’s rescuing of Roy Hodgson’s mess in 2010/11 – with some exciting football in those first few months – the abiding memory, rather than some dogged cup runs (one trophy) and stodgy league form a season later. I always use the examples of Holland in 1974 and 1978, Brazil in 1982, Hungary in 1954, and all those teams who won nothing yet are remembered decades later; and all those long-forgotten winners of minor trophies.
So, for the most part, trophies are random – and certainly the domestic cups are, given that clubs at all levels rest players due to the importance of the league (and Europe). A competition where half the teams don’t even want to be there is not a good gauge of a team or manager’s quality. (Equally, Liverpool had an insane injury crisis a couple of Januarys ago, so that put paid to cup progress then. And here’s hoping the Reds have at least a five-a-side team left after the decimation during this latest international break.)
“He has to win something” is therefore total guff. Being competitive, and trying to win things, is what matters, but focusing on the League Cup, just to say “look, we won something!” is a near-waste of time. It’s almost as facile as counting the Community Shield as a proper trophy.
Fixtures
Form follows function is the old design adage, but football form relates to who you play, and the spacing out of those games, as to whether or not you can adequately function. We should all know now that it’s tougher to be successful with fewer days’ rest; saying “they’re professional athletes” could not make a marathon runner or footballer repeat their best efforts if told “right, now do that again”. We know players tire during matches, and get cramp, etc., but some people still don’t seem to fathom the concept of full recovery time.
(As an aside here, I recently watched a BBC documentary on the late Sir Roger Bannister, the first person in the world to run a sub-four-minute mile, back in 1954. Sports science has obviously moved on since then, but even then he knew not to train for five days before going for the record, to spare his body and save his energy. He didn’t run his fastest possible miles day in the build-up – he gave his body time to be at its optimum level. Sportsmen train harder now, but would a marathon runner run a full-speed marathon on the eve of a big race? Even now, only 1,000 or so people have broken the magic four-minute barrier, thought to be “physically impossible for mankind” at the time; just like driving 30mph in a car at one point was considered beyond what the human body could endure intact. Anyway, three times as many people have scaled Everest, another feat first achieved in the mid-‘50s, than run sub-four-minute miles… and here ends the brief historical interlude.)
While Arsenal’s encouraging run of nine wins in a row is getting them noticed, they’ve beaten struggling Premier League teams (often whilst actually “losing” on xG), and smashing away the worldly wonders of Vorskla Poltava, Brentford and Qarabag. Easy league games followed by easy cup games: a dream for a team of flat-track bullies (even if, to win any nine games in a row is still an achievement, albeit one further tainted by the opposition having so many chances and failing to take them. Arsenal are clearly now a good side, on the right path, but what more?)
The fixture list is becoming something of a joke for Liverpool. Liverpool’s two toughest 10-game starts on paper – using the ELO rankings index to gauge opposition – in the past 26 years (at least) have been last season and this season.
Now, these two recent runs include European opposition too, and so being in the Champions League increases that possibility of a couple of additional tough matches; although to play PSG and Napoli in your first two European games, whilst also playing Spurs (a), Chelsea (h), Chelsea (a) and Man City in the same short timespan – where each game’s tolls adds cumulatively to the next – is pretty grim luck.
The idea that Liverpool are having some kind of wobble is to ignore, for example, the effort required to go to Chelsea and Napoli in the days before the team with the most successful league season in English football history turn up after a far less daunting schedule. (If anything, that Chelsea away game looked brutally fast, and the Londoners we then able to rest key players for their midweek game, to be fresh for the weekend, while Liverpool went to an Italian team who got 91 points last season.)
Klopp’s only other full season ranks 5th for the 10-game opening difficulty, behind two of Rafa Benítez’s. (Not only do Liverpool genuinely win far more penalties on average when they have British managers and a greater number of British players in the team, but the fixture list also seems to count against its foreign bosses. Which is not to say that the fixture list is a scam, but it’s another odd occurrence; only partly explained by those foreign bosses having a better record at taking Liverpool into the Champions League. Perhaps the other contributory factor is that English Champions League teams face each other in the first few months of the season, but is this consistent? Not everyone seems to get the tough schedules.)
In other words, no other Liverpool manager since the title was last won has been so up against it from the start. That does of course mean that theoretically things get easier later on, and that’s potentially good news. But as we can all see lately, league titles seem to be (all but) won earlier in seasons, with unassailable leads racked up; often by teams not in Europe. To have a tough Champions League group and a tough opening couple of months of Premier League fixtures makes a genuine title tilt extremely difficult. As it happens, the Reds probably have more points than anyone expected from the run of games.
So three cup finals and two top four finishes (and joint top with 2.5 points per game) in three full seasons – after inheriting a team in mid-table – is a vast improvement on the “norm” for Liverpool in over a decade.
Of course, as my research has showed, an excess of cup games – as Liverpool have had in Europe under Klopp – takes a lot of points off your league campaign. To reach the Champions League final an English club will on average lose seven league points when judged against their own tallies the seasons before and after; but if the club in question doesn’t have a mega-squad in size and cost (and Liverpool did not last season) then the average points dropped reaches 11. (The costliest squads to also excel in Europe since 1999 – Man United and Chelsea – have lost some league points when reaching the big European final, but the less costly squads – Liverpool and Arsenal in the 2000s, and Liverpool last season – average double-digit league points losses.)
I heard the theory on the Independent podcast (I think) that Klopp’s teams always do well in either Europe or the league; never both together, dating back to his time with Dortmund. But this is the basic science of a non-financial behemoth in a top European league. Who does well in both the Champions League and their domestic league unless they have a monstrously big squad?
Only the über-rich clubs with the mega-squads tend to be able to compete on two fronts; and at Dortmund Klopp was already pushing the envelope compared to the budget he had. This failure to compete on two fronts could be put down to his intense style of play, but it’s more about not having 24 largely interchangeable players due to unlimited funds.
Squad size and squad quality almost always comes down to money, as you can beat the system with more clever buys than the average, but to do that in order to build – and then pay the wages of – a big squad is almost freakishly impossible.
The same was true of Rafa Benitez’s Liverpool in each of his seasons: poor in the league with a weak squad but won the Champions League; very good in the league and FA Cup, but out early in Europe; Champions League final, decent in the league but tailed off when Europe became the priority; reasonable in the league and good in Europe (semis); and then finally, in 2008/09, good in Europe (quarters) and excellent in the league (86 points and only two defeats).
(Even in Rafa’s sixth season, when the league form fell away quite badly, yet another European final was arguably only denied by Eyjafjallajökull erupting in Iceland; meaning that, like Barcelona in the big cup, the Reds had to travel across Europe for their away ties by road and rail – in Liverpool’s case, to Madrid. Both of the teams that had the tougher journeys – when their away games in the semi-finals coincided with the flight-halting Eyjafjallajökull, before air travel resumed – were surprisingly dumped out; in part because it’s a frigging nightmare to prepare for a football match that way. Again, randomness. Eyjafjallajökull has to count as force majeure, i.e. fucking bad luck.)
Only in Rafa’s 5th season was a decent attempt made on the two main fronts; but at the same time, Man United were interchanging or combining Cristiano Ronaldo, Wayne Rooney, Dimitar Berbatov and Carlos Tevez in attack, whose fees (after inflation) and/or wages absolutely dwarfed what Liverpool were paying for, and paying to, their best players – in pipping the Reds in the league and also making it to, but losing, the Champions League final. Liverpool could probably match United’s first XI (bar full-backs) from that time due to an outstanding spine, but United, whose squad cost almost twice as much, naturally had more depth. In 2018 football money, the squad cost differences in United’s favour were £1,201bn vs £725m, and the £XI differences were £635m vs £388m.
You simply can’t do it all unless you have a £1billion squad.
This side could match the “achievements” of 2008/09, but again, trophies are random. The strength of rival teams varies from season to season, on top of the general randomness, such as Fernando Torres missing a lot of that season, and he and Gerrard rarely able to play in the same team that year.
This current vintage is perhaps the best all-round Liverpool side since 1987/88, but Man City are obviously up there with the best English sides of all time. (So, on a par with that 1987/88 team.) City under Pep Guardiola are more of a force than City under Manuel Pellegrini, and Klopp has no control over such things. If Guardiola went back to Barcelona instead of Manchester, Liverpool’s odds of winning the league would improve through nothing that Liverpool themselves had done.
While I’m a huge fan of Gini Wijnaldum, and James Milner is having a great twilight to his career, and Jordan Henderson is underrated by many, a midfield three of peak-years Steven Gerrard, Xabi Alonso and Javier Mascherano would turn this team into a force beyond belief. Indeed, assuming everything balanced up with the existing defence and attack, it would probably make for the best Liverpool side ever.
But in 2018 money the two imports cost Liverpool a combined £157m (£77m for Alonso and £80m for Mascherano), while Gerrard, if he had to be bought from elsewhere, would be a £200m player based on what Chelsea were offering in the mid-2000s.
Liverpool’s current midfield, including backups and players being eased in, was not free, of course (just as Liverpool’s backups in 2008/09 were not free). But it shows how having an extra £200m to spend – and the capability to pay the wages of that calibre of player – can really make a difference. Liverpool might have been able to buy “world-class” midfielders in 2018 – the established elite world stars – but, based on the way the books need to be balanced, at the cost of not having Virgil van Dijk and Alisson.
And of course, therefore there’s not the kind of depth seen at Man City, and possibly even Man United (squad costs of players used this season by each of those two at over £1bn, compared to Liverpool’s £554m), although all United’s established elite players are currently being devalued by the football the team plays.
Gary Neville was 100% right to say a few weeks ago that Liverpool would have a better chance of winning the league this season if they went out of Europe early; but where he was wrong was to say Liverpool should “bin off” the Champions League. You can’t choose to opt out, especially as City could get 100 points again and then everyone will be saying to Klopp “where’s your trophy?”, and “why didn’t you focus on Europe?”
My guess was that Klopp was trying to win in Napoli a fortnight ago with his strongest XI, to try and go a long way to getting the group stages wrapped up early, to allow for some resting and rotation in the final two games.
But Liverpool looked leggy after the monumental Chelsea battle, and then were not as fresh for the City game as they were in previous clashes with the Citizens. It backfired, but had Liverpool won in Naples, confidence would have been sky-high and maybe the tiredness would not have been felt so immediately against City; and of course, it would have allowed more rest-time later on, as the group became a series of dead rubbers if Liverpool performed as they should be able to in the Red Star games, to be on 12 points.
So I think these can become no-win situations, in some senses, as there’s always some kind of cost: dropped points vs fatigue, with rotation, the other option, protecting players but leaving the either-way outcome of a disjointed team stuttering or those fresher reserves pulling together well.
Ratings Performance Index
Over the past couple of seasons subscriber Tim O’Brien has posted on TTT about applying the American model – Ratings Performance Index – to the Premier League, showing in 2016 and 2017 what the RPI table looked like after a quarter of the season – more-or-less where we are now. Each time Liverpool had endured a tougher-than-average fixture list, so it was a helpful guide to some of the underlying factors.
Both Graeme Riley and Terry Dolan have created their own RPI models and have been discussing them on the site this past fortnight. (Not to be confused with TPI – the Transfer Price Index – that Graeme and I created in 2010, to provide a tracking of transfer inflation, and also, to look at how much each team costs each season: the aforementioned £XI; nor to be confused with the Retail Price Index, which tracks the costs of produce.)
Basically, the concept of this RPI is to “score” each team’s league season so far by weighting it against the quality of the opposition, with the quality of opposition determined not by the ELO, or last season’s finishing positions, or spending power, but the percentage of points won by that opponent this season; so, a kind of form/quality hybrid. (The methodology is explained in the footnotes to this piece, to save bogging the article down in the mechanics.)
So, teams with fewer actual league points may be listed as higher in the table if they had good results against higher-rated teams (Liverpool, West Ham), rather than excellent results against poor teams (Man City). Indeed, it’s the same top four as in the actual Premier League table, just in a different order; with West Ham 5th in the RPI table, on account of having played pretty much only teams in good form, and at least got a couple of very good results.
This does slightly punish the “you can only beat what’s put in front of you” narrative, but the point is to create a table that will more closely resemble the final league table than the current league table is ever capable of doing; and over the past two seasons, that’s exactly what the RPI table has done.
For our book Boom! I went back just before the end of last season and looked at how Tim’s RPI table from the 9th game (PL9) looked compared to the table with two games to go at the time of writing (PL36); and did the same with the actual league table from PL9 vs PL36.
Well, if you took the league table from PL9, you’ll find eleven teams who, seven months later (PL36), currently sit within three positions of where they were in the actual league table in October, with an overall average of 3.9 places difference. However, when comparing Tim’s RPI from PL9 against the actual league table after PL36, no fewer than 15 teams sit within three places, for an average of 2.9 places difference.
At the time of writing Liverpool have risen from 9th to 3rd in the actual table, having been 2nd in the RPI table after PL9. In October West Brom were 13th in the actual table, but sat 20th in the RPI version.
So basically, RPI called Liverpool being much better than mid-table (no surprise, although some fans were panicking), but said that mid-table West Brom were in big trouble; at a time when people were talking about Liverpool’s crisis and nothing was being said about West Brom’s impending doom.
Now, RPI doesn’t guarantee that your team won’t have a total loss of form, an injury crisis, a managerial meltdown or a mass food-poisoning – or that an owner won’t sell the entire team in January and replace it with the U16s (I’m looking at you, Mike Ashley) – but it does give a bit more context to the league table, which, according to a friend of Jonathan Wilson’s (as mentioned on the Guardian podcast), would need 35 years to even itself out in terms of luck and randomness.
Which, of course, is not possible – but even the final table tells some kind of lies (such as Man United last season being deemed the luckiest in the league by an academic study by Bath University, in terms of refereeing decisions and other factors, and Liverpool the most unlucky, with a double-digits loss of points due to officials making basic errors; whilst xG tables put Liverpool closer to Man City, and Man United closer to mid-table).
Add that Liverpool, as noted earlier in the piece, probably lost around 10-12 league points from making it all the way to Kiev with a non-massive squad, you cannot say that United were “the 2nd-best team in England last season”; especially after the kind of early and abject surrender in Europe usually only seen from the French. (Topical humour there.)
However, what’s most remarkable here is that Graeme, using much the same RPI methodology (see his whole explanation and comment at the end of this piece) – backdated to the start of the Premier League era – cannot find another single team in those 28 seasons with an RPI score as high as 0.57.
In other words, no other team has had as many as 20 points when having played such a tough opening league schedule. Some teams may have had a very small number of points more than Liverpool at this stage, but only with “easier” starts – based on the form of all the teams in the league up to that point of each season and other form criteria.
To see the latest RPI table, visit Terry Dolan’s site.
Klopp vs Spending Model (£XI)
Okay, we’ve had RPI, now back to the TTT model of TPI, which dates back to 2010, when Graeme and I co-created the model. On this site we’ve been using this, with the exact same methodology, to take the temperature of Liverpool’s fortunes ever since; not creating it to favour Liverpool, or any particular Liverpool manager – just to get an objective view of performance vs finances.
On average, ever since the Roman Abramovich era began, if an £XI costs £600m+ in 2018 money it can on average expect a haul 80.7 points.
Since 2003 there have been 33 teams with an £XI between £600m and £1,007,000 (the latter being Chelsea in 2006/07, the highest average XI cost in our records). These are Manchester United (13 times, or seasons), Chelsea (12 times) and Man City (eight times). Remember, the £XI is just the average cost of their starting XI in each of those seasons, adjusted to 2018 money; not the total cost of the squad.
There are a further four “teams” who have £XIs in the next bracket down: £500m-£600m. These are, in descending order, Chelsea, Chelsea, Man United, Man City, Chelsea. Combined with the £600m+ teams, that’s the 38 most expensive teams each season in a 15-year period limited to just three clubs.
This is why I talk of them as the Rich Three, within the Big Six. The Big Six is a misleading term as the financial gulfs between the Rich Three to the Poorer Three is similar to that between those poorer Big Six clubs and, say, Crystal Palace or Leicester. Arsenal, Spurs and Liverpool have a Big Six pedigree and history, but not the funds to compete with the Rich Three.
That said, Chelsea are falling away; from a £1bn £XI eleven years ago to around £500m so far this season.
Liverpool are currently around the £390m mark. That’s right – “big spending” Liverpool have a team that would not be classed in the 50 most expensive Premier League club seasons since 2003. Every title in that time, aside from Leicester, has been won by a team that costs £585m–£916m.
So, to expect Liverpool to win the league based on spending is preposterous. The club rank 4th in the £XI rankings this season, over £100m behind Chelsea and c.£200m behind the Manchester clubs; while the financial gap between the squad costs is bigger still.
Now, Liverpool’s figure is currently lower than I anticipated it being this season, and the average is more likely to increase than decrease. To date, cheap or free players – in transfer terms – like James Milner, Joe Gomez, Andy Robertson and Trent Alexander-Arnold have been in the side in pretty much every league game; while more expensive players (c.£40m or more in TPI terms), such as Jordan Henderson, Fabinho, Dejan Lovren, Alex Oxlade-Chamberlain and Adam Lallana have featured much less than expected – or, due to injuries, not at all.
This currently ranks as Liverpool’s 6th-most expensive £XI of the Abramovich era (2003––), ranking behind all of the teams funded by FSG’s initial spending spree (2011/12 – 2014/15), when the value for money in the market was not so great.
And the 2018/19 £XI is more-or-less exactly level with the £XI of 2008/09, which was Rafa Benítez’s most expensive side, and also his best (but which was still a long way behind Chelsea and Manchester United’s).
The average number of points for clubs with an £XI of £390m is 69; while the current side’s pro rata total would extrapolate 95 – which may seem fanciful (and way beyond what we are used to), but of course, Liverpool have had a much harder than average fixture list so far, so it’s not too fanciful. In reality we can’t expect 95 points – nothing in the past 30 years suggests as much – but to be on course for it after a tough schedule is hugely promising.
Indeed, there isn’t a lot of difference in the points tallies of clubs with £XIs of £300m-£400m and those between £400m-£500m. This mid-range is almost exclusively clubs like Liverpool, Spurs and Arsenal.
Go below £300m, however, and the average points tallies from £200m-£299m (30 teams) drops to 60 points.
Go above £500m and the average rockets to virtually 80 points – a financial mark Liverpool have not hit in the Premier League era (peaking at £465m in 2011/12), and a points tally only reached by the club in 2002, 2006, 2009 and 2014 – which makes all of those seasons overachievements against the £XI-Points model. (While often, being below 65-69 points is an underachievement, although as ever, cup runs may be mitigations for this.)
Liverpool’s £XI last season – and remember, all of these £XIs are all converted to 2018 money – was £348m; so, almost £50m lower than so far this season. Even without several of the Reds’ more expensive players, the sale of Coutinho and the ever-presence of Alisson and van Dijk have upped the ante by a net of £50m so far – just not to anywhere near the levels of the Rich Three. Getting Fabinho into the team isn’t going to radically alter this, but it could bump things a bit, especially if he replaces Milner.
Of the nine teams to have £XIs around that value (£390m) since 2003 (all either Liverpool, Spurs or Arsenal), Liverpool’s tally of 75 points in 2017/18 is five points better than the next-best contender, and 11 points better than the average. And none of those other eight teams reached a European Cup final at the same time.
(As an aside here, only three times has a team with an £XI less than £300m finished with 80 or more points: Spurs two seasons ago, with 86; Arsenal in 2007/08, with 83; and Leicester when winning the title with 81 points in 2016, with an £XI of … £58m! To put the Foxes’ miracle into context, no other team with an £XI below £100m since 2003 has finished with even 60 points, let alone 81. That season will never make any sense…)
I’d still expect Liverpool’s £XI to be over £400m this season, unless there’s a major injury crisis. And I’d expect – and hope for – more than the 65-69 point average the kind of outlay usually guarantees. (Including only his full seasons, Klopp is averaging 77 points, but again, that includes the league damage incurred from the European run last season, and so far this season the points per game is better than ever.)
But both Manchester clubs could easily end up being over the £700m mark, just like last season. Chelsea will be over the £500m mark. So if Liverpool top £400m, it’s within this context.
What Klopp is attempting to do – be very good in Europe and win the Premier League – is utterly unprecedented in the modern English game on a financial wherewithal basis. It may well be asking too much, but it’s hard to not even try.
To reverse the Points–£XI study, all the teams that got 90 or more points have an average £XI that’s over £700m. The teams that averaged 85-89 points have an average £XI of over £600m. The teams that averaged 80-85 have an average £XI of over £500m. The teams that averaged 75-79 points had an average £XI below £500m. And this continues; as the points averages drops, then so too does the cost of the to reach those levels.
The graph below shows that the eight points bands between 90+ and 55 all have a fairly similar stepped declines in how much those teams cost to achieve those tallies.
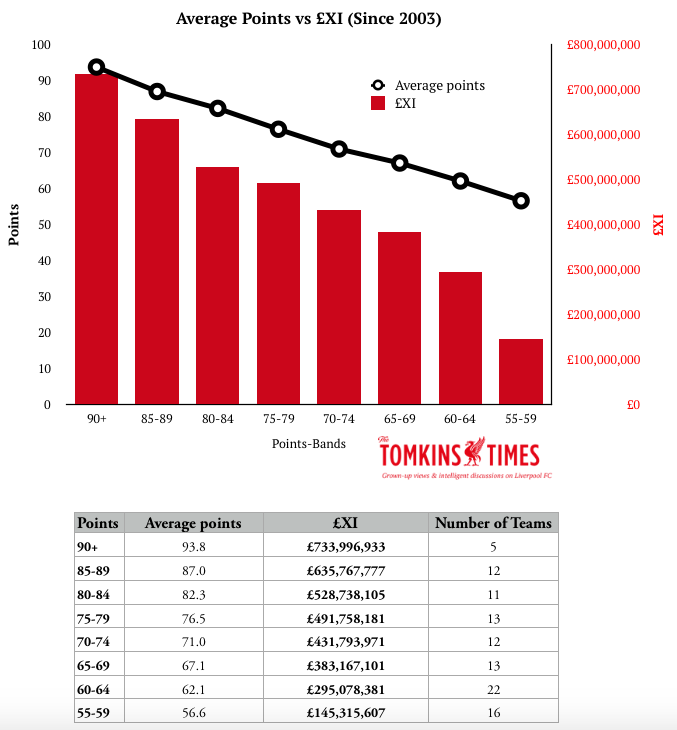
To me seems one of the starkest examples of the correlation between money and success.
Maybe this isn’t unequivocal proof of causation, but there continues to be a strong correlation between the £XI and what your aims are; barring, of course, the occasional outlier.
(NB: below the 55-point mark is an utter mess, with no such beautifully stepped patterns in relation to spending, although the teams with really terrible points tallies tend to be cheap. Teams of all ranges of £XI – from the cheapest recorded £11m of Blackpool in 2010/11 up to the near-£600m Chelsea side of 2015/16 – can get dragged down into the morass of the sub-55-point territory, but since 2003 only Leicester have done the reverse and been ultra-cheap and at the top end. Ergo, as I’ve always said: it’s easy to fuck it up on a big budget but near-impossible to work miracles – at the top end – on a small one.)
Win-%
Klopp’s win percentage of 53% is not a massive improvement on the 52% of Brendan Rodgers, but it’s vital to mark the contrast between the side Rodgers had one exceptional season with and the one he bequeathed almost 18 months later. After all, his final 18 months had a win-% of just 45%, and he lost a staggering one-third of all games in that time.
This is the most important bit of context surrounding the job Klopp is doing. In terms of £XI there hasn’t been much difference between those from Rodgers’ time and Klopp’s.
More important than anything else, you have to look at the canvas and materials a manager works with – and Klopp had to rip up a hell of a lot of what he inherited.
(Also, as an aside, people have been saying that Jose Mourinho’s win-% at Man United is the same as Alex Ferguson’s, but that ignores that Ferguson had several poor seasons to start with, and that win-%s in the 1980s and 1990s were generally much lower than now, with the rise due to the mega-squads developed by the über-rich clubs and the increased financial gulfs across the league as a whole; in the ‘80s and ‘90s the poorest clubs were not as cut adrift as they are now, and the richest clubs were more closely clustered together. Rodgers had a better win-% than Bill Shankly, to show how dodgy the comparison can be.)
Inheritance and Transfers
It’s a little disingenuous to look at the bench for Klopp’s first game in October 2015 – full of rejects and never-has-beens – in order to assess what he inherited, as that wasn’t representative of the squad Rodgers left, not least due to several injuries at the time.
Equally, we can’t escape the nightmare of the majority of Rodgers’ personally-driven transfer business, even if some of his picks – James Milner, Dejan Lovren and Adam Lallana – are having, or have had, some kind of renaissance with the better fitness conditioning and tactical structure now seen at Liverpool.
Milner, Lovren and Lallana are good, but not necessarily the kind of players you build a team around. (Which isn’t to say that the committee were necessarily opposed to them. It’s hard to think of anyone opposing the procurement of Milner on a free transfer, for example.)
I’ve discussed this before, but I just can’t get away from the way Liverpool were operating under Rodgers to the way they are now. The fact that the committee and the manager couldn’t agree on players was hugely problematic, causing a kind of fudging that meant some committee picks were bought but then weren’t selected for the team by Rodgers, and he himself put his faith in Christian Benteke, who appeared to have lost the pace and confidence that made him a danger at Aston Villa, within a totally different style of football.
Benteke wasn’t actually terrible at Liverpool, but like Joe Allen, Nathaniel Clyne and Danny Ings, had certain limitations that made it feel that Liverpool were assembling something closer to a mid-table side. (While Fabio Borini and Rickie Lambert looked very mid-table in all respects. Kolo Toure was simply too old.)
Obviously the Reds were not in the Champions League in all but one of the four seasons Rodgers started, although that was in part due to the Reds falling short in two of his three full seasons – which, even then, wasn’t entirely his fault, due to the Reds having the 5th-biggest budget at the time, in trying to break into the top four. As I said back then in his defence, 5th was par; although the incredible 6-1 defeat at Stoke turned that into 6th, and below par. (And from then on the wheels totally came off.)
And I have no problem with signing players from mid-table sides, as not everyone is at their ceiling at such a club; see Sadio Mané, for example. And I argued at the time that some of these could have been good signings.
But between three and six years on, none of Rodgers’ signings, bar Milner, are amongst the first-choice players at clubs better than mid-table in the Premier League or other elite leagues. (Borini is at AC Milan, but of course, they’re mid-table right now. And last season he was converted to full-back.)
The committee had some big gaffes in there too, including Lazar Markovic, who, even if harshly treated initially by Rodgers, has done nothing to help himself out of the hole into which he was put. Indeed, some of the committee signings are also now at mid-table teams or below. There will always be flops in the transfer market.
But of course, the committee gave the Reds the wonderful Bobby Firmino, and in the January of 2013 (after Rodgers’ terrible summer business in 2012) provided the huge uplift generated by the arrivals of Daniel Sturridge and Philippe Coutinho (before Rodgers regained more say in transfers, perhaps understandably – if mistakenly with hindsight – after the hugely impressive surge in 2013/14; albeit a surge, perhaps crucially, powered by players he didn’t buy).
Firmino, Coutinho and Emre Can are all regulars for massive title-hunting Champions League clubs (and still at great ages), while even much-maligned committee signings Iago Aspas and Luis Alberto are having much better subsequent careers than almost all of the players Rodgers brought to Anfield. And of course, Daniel Sturridge was an elite player, before injury struck. Firmino, Coutinho and Aspas all now star for major nations, even if the latter is never going to be world-class.
In fairness, Lovren had a great World Cup, but now aged 29, will soon join Lallana and Milner on the wrong side of 30. These are players with limited resale value during their entire time at Liverpool, and while the concept of resale value gets mocked, it is the £142m that Coutinho brought in (after several years of good-to-exceptional service that, like Luis Suarez before him, propelled the team into the Champions League) that allowed Liverpool to buy one of the best goalkeepers and one of the best centre-backs in the world. Rickie Lambert wasn’t going to do likewise.
Rodgers seemed intent on raiding his ex-club Swansea, in the way that managers do; but there was no great advantage for Liverpool due to Swansea’s mid-table existence, and where further mediocre targets, such as Ashley Williams, were also sought. Players can be improved with coaching, but none of Rodgers signings significantly improved under him.
And Rodgers went for obvious, but often uninspired, “proven” Premier League players, from the pool he knew, rather than those capable of becoming truly exceptional talents from the vast oceans beyond – the other 99% of the football-playing world, which you need scouts and analysts to cover, and is why some kind of transfer team is now so important.
(For the record, I’m not sure whose idea Victor Moses was, but he’s had a really good time since leaving his Reds’ loan. Ditto Mario Balotelli, who was a compromise that worked out dreadfully, although he’s gone on to star in France – but despite this, nothing he could do after leaving Liverpool would convince me he wasn’t a terrible fit at Anfield.)
As I’ve noted for three years now, even Joe Gomez was a committee pick that Rodgers vetoed for 18 months until his new assistant manager, who knew the player, reversed this decision (but without Rodgers publicly acknowledging that Gomez was actually a long-term committee choice, and instead giving all the credit to Sean O’Driscoll, which then reflected back on himself).
If the distinction here seems petty, in that Gomez was still signed during Rodgers’ watch and with some input from his new assistant manager, it’s indicative of the internal battles that were driving the club towards mediocrity. Gomez should have been signed when he was first identified, not due to the vagaries of backroom staff appointments just happening to know them personally; and in those 18 months Liverpool got lucky due to no one else moving in on the Charlton defender.
All this work needed undoing.
“Gordon looks back on the signings in January 2013 of Daniel Sturridge for £12m from Chelsea, and Philippe Coutinho for £8.5m from Inter Milan, as the point when he knew a corner had been turned. Despite the brilliant 2013-14 season, however, an obstacle was Brendan Rodgers — because the then manager did not believe in the model.”
(And this – Rodgers’ distrust – was after the transfer committee gave him those aforementioned jewels in 2013. Edwards was also presumably part of the process that brought Luis Suarez and Jordan Henderson to the club.)
The truth is that the bulk of the team now revolves around signings driven by Klopp and the transfer team. Only Milner from Rodgers’ own picks remains a first-choice just three years later, with Henderson dating all the way back to Kenny Dalglish and Damien Comolli (and Edwards). So while listing the subs from Klopp’s debut game is unhelpful in showing what Rodgers bequeathed, that part isn’t.
The reason I believe Rodgers – clearly a talented coach – didn’t get a vacant Big Six job in England this past summer is because of how poorly he performed on transfers, working against the committee – when pretty much all major clubs now want their managers to coach, and limit or partly limit their input on transfers. (Klopp is different here: he worked with his Director of Football at Dortmund, and he instantly united the transfer process at Liverpool. At Liverpool he has the final say on players, but ideally everyone has to be in agreement.)
Arsenal, it seems, didn’t even consider Rodgers – but spoke to the assistant managers at Man United and Man City, and given what happened at Liverpool (and the timing of it all) I’m guessing they spoke to Klopp’s assistant too. They were looking for coaches, not traders. They’d already assembled their transfer team.
Comparing Klopp and Rodgers may seem like old news, or an irrelevance in 2018, but the direction of the club in 2015 was largely determined by Rodgers. Not every decision Klopp makes now relates back to Rodgers, but many of the main ones in the first year or two did.
Klopp didn’t have a blank canvas to start with: he had Rodgers’ canvas, and relatively limited funds – beyond what he could help the club generate – to make sense of Rodgers’ painting, and to adjust it into something more appealing.
And part of the time he has spent has been in painting over most of it with whitewash in order to start from scratch. (Klopp generated extra money by qualifying for the Champions League in each of his full seasons to date, enjoying two financially-rewarding European campaigns, and from helping Coutinho to become a player worth £142m.)
Rodgers did some great work while at Liverpool, but it was fleeting; none of it resulted in any solid foundations. And I think that’s the main point I keep coming back to, and actually what I have been trying to articulate whenever there’s some kind of Klopp vs Rodgers stats (52% vs 53%, for example), or a look into the progress being made.
And it’s why I think it’s vital to clarify that Rodgers did some great work, rather than did a great job. Because the latter would have meant a much better bequeathment, and a superior overall performance. Vladimir Smicer wasn’t a great Liverpool player, but he did well at times, and did a great job in Istanbul.
Perhaps painting is the wrong metaphor here, and it’s fairer to say that Rodgers built a wonderful sandcastle, that was all-too-briefly beautiful – ephemeral, if you will – while Klopp is building advanced modern architecture with concrete and steel.
But even what Klopp is doing won’t last forever; nothing does. However, if there’s only one player from this Liverpool team in the side in 2021, I’ll eat my sombrero.
Appendix: Footnotes and Further Info
Appendix: Explanation of Ratings Performance Index by Graeme Riley, Plus His Variations and Analysis
TTT has previously taken a look at RPI (Rating Percentage Index) in the past, but as background I’ll give a brief description of the way it works. In American college sports, there are so many different colleges that it would be impossible for every team to play each other and so a system was designed to be able to compare teams who play different numbers of matches against different quality of opposition.
Each team’s results are added together but assigned a weighting of only 25%. A home win in this case is given a score of 0.6 and an away win a score of 1.4, reflecting that it is more difficult to win away from home. A loss is given a zero rating in every case. Given the American aversion to ties (or draws), there is no consideration given to these as they simply do not occur (or so rarely as to be ignored) and so unfortunately, we will have to do the same here, effectively leaving a draw as the same as a loss. You either win a match, or you don’t. The points gained are then divided by the number of points available.
Where the calculation becomes more difficult, is that a second component is then added. The same scoring methodology is calculated for the opposition team’s results, this is then added with 50% weighting to the first team’s score to reflect just how good the opposition have been.
In a final calculation, the difficulty of match of the opponent’s previous opposition is calculated and assigned a 25% weighting to your score.
So we have 3 elements – how well have you done, how difficult were your opponents and how difficult were your opponents’ fixtures. Clearly the higher your combined score, the better you are doing against expectations. The maximum score is 1.00, but even if you win every game, this is likely to drop as the quality of opposition will drag your rating down.
I will slightly deviate from the methodology for one piece of the calculation however. Normally, this will take place to cover a whole season and so at any point during the season, all previous rankings are retrospectively taken as the year end position. Instead of this, I have calculated the RPI based on matches to date and then used this for the next match without restatement. This, to me at least, gives a better feel for the rating based on current form and most importantly quality of opposition at that point.
The impact of this change can be demonstrated by looking at the top three teams, Chelsea, Man City and Liverpool, who are locked closely together within 1% of each other under the full season method. However, based on the cumulative method there are some significant changes.
So how does this measure up? Looking at the table after 8 matches in each season since 1992-93, we get a feel for how well Liverpool are doing in reality this season. The low point, naturally, was 2010-11 when the rating stood at 0.19, reflecting the dire start to the season and lack of success against the likes of West Brom, Birmingham and Blackpool where only 1 point was won between match-day 5 and 8. Indeed, out of all clubs, this ranks in the bottom 10% of worst 8 games starts to a season.
At the other end of the scale, Liverpool’s best start to a season was 0.50 during 2008-09, a run of six wins and two draws even if the quality of opposition was not at it’s best. Above this come just three other wonderful starts to a season by other clubs, Chelsea (0.56) and Man Utd (0.52) in 2009-10 and at the top of the tree was Chelsea’s 0.565 in 2005-06. So clearly any score above 0.50 is excellent, having occurred only 6 times across all clubs so far. Indeed Man City’s start last season was good but not spectacular, rating at 0.48 with a series of easy wins, the most difficult being against 10 man Liverpool and a struggling Chelsea side.
So this is the context behind the current season, which sees table toppers Man City rated at 0.38, Chelsea coming in at 0.40, both behind surprise success stories Bournemouth (0.42) and Watford (0.42). Ahead of these are Spurs, rated at 0.46 and so only just below the pace set by Man City last year. However, top of the pile come Liverpool…..with a record, all time Premier League rating of 0.57.
Hopefully that puts into some perspective the relative disappointment of successive draws against the top two teams. So not only is it a fantastic start for points gained by the club, it also reflects the best ever return given the quality of the opposition faced.
Appendix: Article from Boom! On How the 2017/18 Season Panned Out vs RPI
Earlier in the season (and indeed, in this book) I discussed TTT subscriber Tim O’Brien’s version of the American statistical model, the Ratings Percentage Index (RPI), to highlight how unreliable I suspected the league table of being in October (after Premier League match nine, aka PL9), when Liverpool sat 9th. RPI is calculated by looking at the form of the teams played, to add some context to unbalanced fixture lists.
At the time of writing, with two league games to go, the table should now be a more ‘honest’ reflection of quality and consistency. So, how did RPI compare?
Well, if you took the league table from PL9, you’ll find eleven teams who, seven months later (PL36), currently sit within three positions of where they were in the actual league table in October, with an overall average of 3.9 places difference. However, when comparing Tim’s RPI from PL9 against the actual league table after PL36, no fewer than 15 teams sit within three places, for an average of 2.9 places difference.
At the time of writing Liverpool have risen from 9th to 3rd in the actual table, having been 2nd in the RPI table after PL9. In October West Brom were 13th in the actual table, but 20th in the RPI version – so Tim’s model perhaps foresaw trouble for the Baggies that maybe wasn’t picked up on at the time by the wider football public. The model also said that Everton under Ronald Koeman should have been 7th, not 18th, based on the difficulty of opposition faced, and that the few points they gathered were in essence more “valuable”. To see them rise to 8th is merely realigning with reality for a team that spent big over the summer, and nothing particularly miraculous from Sam Allardyce.
Indeed, in the past I have written extensively about predicting team performance when compared against financial outlay; working with Graeme Riley to create the Transfer Price Index in 2010, from which we devised the metric of the “£XI”: the average cost of a club’s line-ups across a league season, when adjusted for inflation.
With near-identical results to the league table from PL9, the £XI rankings for the season have eleven clubs finishing within three places of their ranking, for an average of 3.9 position difference. (So the headline figures are the same, but the finer details of the results vary slightly.) In other words the finances present a reasonable guess at the final table, as does the actual league table with three-quarters of the season to go. But the Ratings Percentage Index is more accurate than the £XI and the league table at PL9, as it was in 2016/17.
To test this, I went back and compared everything to the first league table of the season, which should logically be very random indeed – although not totally random. After one game, both Manchester clubs were in the top three; but so were Huddersfield. Spurs and Arsenal were in the top six, as expected, but West Brom were 8th. Liverpool were 9th, and Chelsea 14th. Overall there were still ten clubs within three places of their position 35 games later, so only one fewer than the RPI and £XI models; but the overall average was that clubs were within 4.8 places, compared to 3.9 places from PL9 and £XI, and against 2.9 places from RPI.
However, where the financial predictor of the £XI comes into its own is in the top half of the table. If you look only at the top 10 £XI rankings, then its predictive power improves to within 2.6 places of expectations, whereas PL9 remains much the same as it was, at 3.7; while the RPI gets better still, at 2.3 places different to the league table in early May.
Look at the top seven, however, and £XI becomes the best predictor of how things will look at the end of the season, compared against the league table after PL9 and the RPI model. The average disparity between the £XI and the league table falls to just 1.3, with RPI at 1.9 and PL9 at 2.7.
In other words, the richest clubs gravitate to the top.
This is probably because the financial gulfs at the top are so marked compared to the differences lower down the table. For example, Southampton’s £XI, at £100m, is only 5% greater than Crystal Palace’s, at £95m. These two are the 8th and 9th richest clubs in the country, based on the cost of their selections, and with such a little difference it’s hard to say which should be finishing above the other. But the two Manchester clubs’ financial advantage over Liverpool is over 200%; their £XIs costing more than twice Liverpool’s. Meanwhile, the Manchester clubs’ £XIs cost over five times the amount of Southampton’s; so if, in a way, the Mancunian pair are twice as likely to finish above Liverpool based on their wealth, they are five times as likely to finish above Palace, and twenty times as likely to finish above bottom-ranked Huddersfield, whose £XI averages out at just £26m.
This (like any other model) can never take into account all the external or unpredictable factors, like luck, injuries, fallouts, inertia, and the number of cup games played, as discussed at the start of this book. Remember: if a club like Liverpool, Arsenal and Spurs plays 20 cup games in a season, then something will most likely be shaved off the league points tally (and the tougher the cup games, the more damage it will logically do). If a club like Huddersfield plays ten cup games, the same will happen. Even the Rich Three could lose ground in the league if playing a lot of cup matches, although it usually takes around 25 extra matches to make a marked difference.