Already this season I’ve been impressed by a number of pieces of evidence that have emerged on how much closer Liverpool were to Manchester City last season than the league table suggested, so I thought I’d lay these out in a rare free-to-read piece on The Tomkins Times, as a point of reference.
In addition, in this piece I’ve included the full details of my own look at how reaching a Champions League final is a double-digits blow to the league points tally of a club on Liverpool’s budget.
A league table is never without additional context. Who had an injury crisis? Who had gruelling cup runs? Who had bad decisions go against them beyond the normal vagaries of luck? Who had more money to spend and the history of bigger spending behind them? Who had the kinder fixture list? It would take years and years for all these things to “even themselves out”. But there’s plenty of ways to dig beneath the surface.
First, let’s talk expected goals, or xG. Unlike possession or actual goals, it’s an incredibly detailed marker of how well a team does at creating good chances and limiting good chances. Only the elite clubs can create lots of great chances (and concede relatively few), and Liverpool were an elite European team on this metric, even before the arrival of Alisson and Naby Keita.
The following is from Daniel Rhodes’ excellent paywalled piece on XG across the world, where Liverpool’s performance can be put into a massively detailed context.
“…Another site to raise its stats game recently has been Wyscout, which has introduced all sorts of filters, and also an xG model. Crucially, this model is applied to all the games they have video footage for, which is as it stands is 211,738 full matches across 599 different competitions with 43,000 teams involved. That has to be the biggest model in the world, surely?
However, before you get too excited, I’ve only managed to collect the relevant data for 21 different leagues and around 350 different teams – split into home and away performances, across all competitions…”
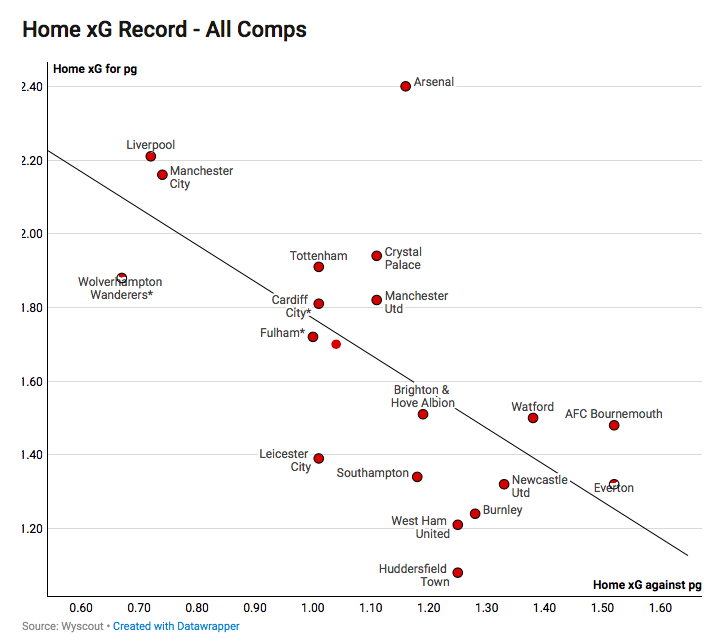
These images of xG that follow below, for and against over the past year (interactive versions of which are available in that article) show that there are two Premier League teams who stand alone from the rest. (The closer to the top left-hand corner in the graph, the better.)
These images show that Liverpool are much closer to Man City than the 25-point gap suggests. If these xG plots can be seen as a team’s DNA, then there’s a big similarity in what these two create in the box and what they give up at the other end – which, essentially, is the nuts and bolts of football, in a way that possession or corners won (or even total shots) is not. (Total shots could include 10 potshots per game, so xG treats these as almost worthless; which, bar the rare screamer, they usually are.)
Remember, Manchester City’s xG was better in Pep Guardiola’s first season than the league table suggested, and lo and behold, better results followed. It is the underlying numbers, the flattening out of the randomness, by using a much bigger sample size, of how goals are often actually scored and conceded.
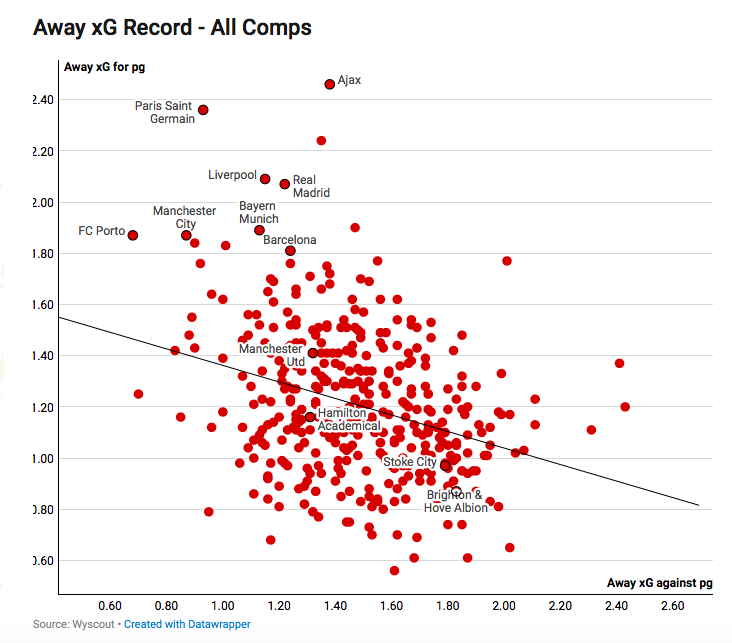
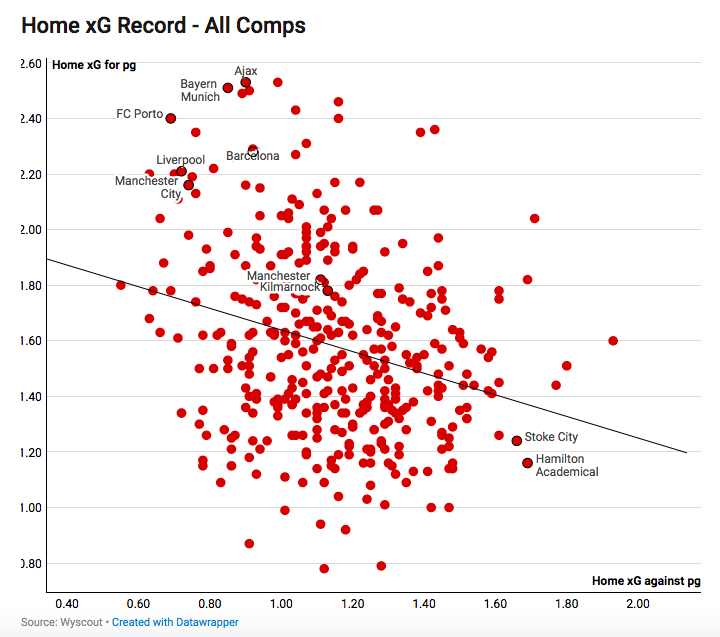
The other European teams in this list are often mega-rich; PSG operate on three times the budget of the 2nd-richest club in France (Monaco), but Liverpool operate on roughly half the budget of the Manchester clubs in England. In Germany, Bayern are a financial behemoth, just as Real Madrid and Barcelona are in Spain. Ajax are the traditional powerhouse of Holland.
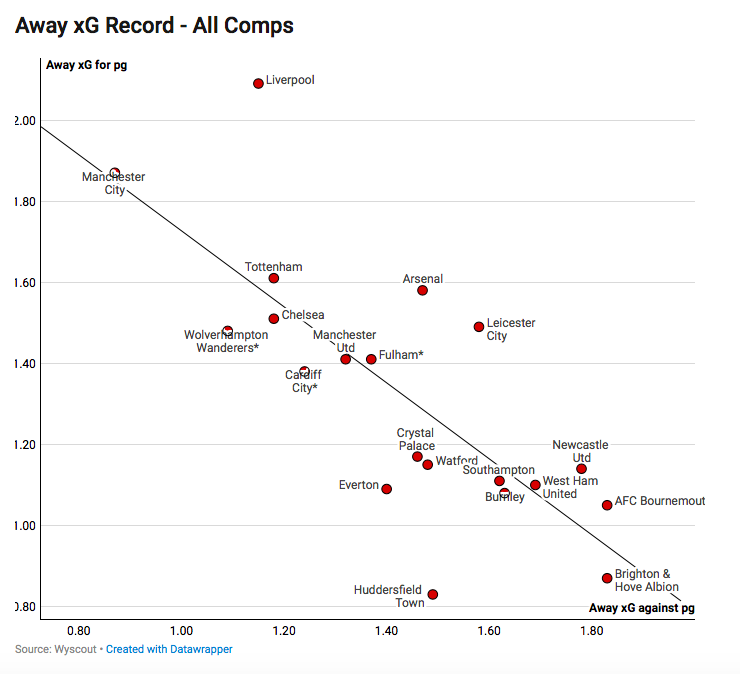
When you filter it down to just the Premier League – but including Champions League games as well – you can see two clubs that stand out; with Spurs a reasonable distance behind, and Arsenal only any good at home (where they create lots of chances but also give up lots of chances). In all of these graphs, Man United are bang-average, and actually have a worse home record than Crystal Palace.
Luck Index
Then, let’s take another look and the vital independent Bath University study said that Liverpool lost an aggregate of 12 points due to bad decisions last season, and City, by contrast, benefited from a lucky handful (which took them from an incredible “deserved” 95 points to an unprecedented 100).
City were still better than Liverpool, but based on xG and the effects of refereeing (which also deserted City in the two Champions League games), fractionally rather than rampantly so.
I spent all last season noting how odd it was that Liverpool were not getting penalties, particularly at Anfield (and Old Trafford), nor were opponents sent off for red-card offences; while the Reds conceded a whopping six penalties, to make for the worst season in the club’s entire history in terms of balancing out those won with those conceded, according to TTT stats and history guru, Graeme Riley.
In Europe, Liverpool got a fair mix of good and bad decisions; in the Premier League, Liverpool were getting nothing at Anfield. Literally nothing. Nada, zilch, zip. This was thankfully backed up by the Bath Uni independent Luck Index, to prove that I wasn’t just being paranoid.
As I noted, Spurs got twice as many penalties at Anfield in ten minutes than Liverpool did in 1,710 (and Everton got as many with one attack as Liverpool got with hundreds and hundreds), and that had to be due to referees being scared of bowing to the Kop. There was no other logical explanation.
(The notion of the Kop winning penalties is such a cliché that referees actively work against it. I mentioned last season how British managers in particular trot out the stereotype after every game, as if it’s still 1979. For the most recent example, see the home game against Brighton last week for the commentator inferring that the Kop’s cries win so many soft penalties; except Liverpool no longer get any penalties in front of the Kop, dating back over a season. Even when a goalkeeper thuds into a Liverpool striker who is simply getting himself under the flight of the ball, it’s a free kick to the keeper. Even a raised hand that blocks the ball does not get Liverpool a penalty, although at least the Reds did get a fortunate goal against West Ham, albeit when already 2-0 up – but that was a mistake of omission, of not seeing something, rather than actively giving Liverpool a big call.)
The lack of a gulf between Liverpool and City can also be seen in the head to heads. Games against one team are never all-conclusive, as we obviously can’t say Wolves are as good as Man City based on their meetings this past year, even if results suggest such a conclusion could be true (ditto Liverpool’s terrible results against West Brom).
For these head-to-heads to properly mean something significant, both teams have to be all-out for the win in a high-stakes game (so, discount Liverpool at West Brom with a weakened side, or in the cup with a weakened side); and the more games the better – like the four meetings between City and Liverpool last season, three of which the Reds won, albeit with the Reds getting an unusual red card in the defeat (the only high-boot red card last season, and not as high as several non-red-cards, including one Spurs got away with at Old Trafford this week) and a couple of lucky calls in the European games.
Of course, Liverpool are also stylistic kryptonite to City, just as Liverpool can struggle against Jose Mourinho’s parked bus or West Brom’s Land of Giants.
The Bath University study said that Man United were the luckiest team in the league last season. Which tallied with what everyone could see over the course of the campaign – with most neutrals utterly underwhelmed by them, and seeing their 2nd-place finish as fluky. This tallied with my earlier observation that, incredibly, they only conceded one penalty all season, when Liverpool and Man City had at least three stonewallers at Old Trafford in a matter of weeks.
United also got 40% of the entire Premier League’s paltry handball penalties in 2017/18, and already have one this season as well; as well as Spurs having a stonewall penalty denied at Old Trafford already, as referees just can’t bring themselves to punish them. Man Utd have tended to do well in the big clashes in 2018, but glaring errors from officials often saved their blushes; although even that couldn’t save them against Spurs.
Europe = Lost League Points
And then there’s Europe and what it does to your league form. We know that the Europa League takes a toll on a league campaign (see Burnley for just the latest in a long line of examples, who play tonight and then have a fortunate United side on Sunday) but no one talks about the Champions League doing the same. But I have the clear data.
There is only one single exception to the rule that reaching a Champions League final takes a chunk off your league points tally; nine times an English club has reached the final since 1999, and eight times it had a lower than expected league points tally.
(NB: Liverpool were the ninth team to do so, last season, but we don’t have a post-final season to create the before-and-after average. But Liverpool did finish with -1 point against the season before; which, stupidly, some people used as a stick to beat Jürgen Klopp with or evidence of regression. However, I am not including this in the averages as we don’t yet have the “after” season data. My hunch, however, is that it will be just as significant as previous examples.)
Below is the data on what reaching a Champions League final does to your league season. It’s fairly extreme. The more expensive the squad the lower the damage to league performance, but even the expensive squads suffer league damage. The data is 100% conclusive on this when comparing the season in which clubs reached a Champions League final with the average of the season before and the season after, with just a marginal positive difference for Chelsea in 2007/08.
Of course, other things are different in the seasons before and the seasons after – buying new players, losing other players – but the result is always the same: fewer league points.
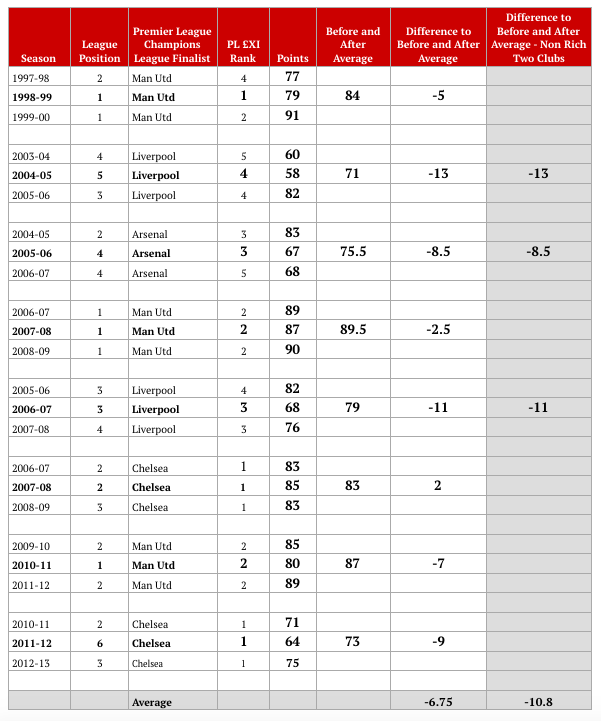
On average, a Premier League team will lose seven league points when reaching the Champions League final. But for Arsenal and Liverpool – teams who were not amongst the two richest clubs in England at the time (and therefore had smaller squads) – the loss has been a staggering average of 11 points.
A statistic that came out just under a decade ago showed than Man United and Chelsea – the richest two clubs in England at the time – had better results after Champions League games during the dominant English spell from 2005-2009 than Liverpool and Arsenal. The squad size had to be the precise reason why. So it makes sense that Liverpool were better than a “75 point” side last season.
This Season
People have talked a lot about Liverpool’s spending this summer, but it doesn’t alter the fact that other clubs had much bigger, costlier squads to start with, and still do.
One summer’s spending does not mean other clubs lose all their previous spending; for example, world-record transfer Paul Pogba is still a Man United player, and with inflation, what they spent is now the equivalent of £130m. (Because £93m in the 2016 market is more expensive than £93m in the 2018 market.)
For almost a decade I’ve been working with Graeme Riley on the Transfer Price Index, which tracks Premier League inflation; and we’ve shown that it currently runs at 27 times the speed of standard UK economic inflation. (By the same token, a pint of milk would now be £10, but obviously it’s not.)
We created the “£XI” – the average cost of every club’s XI across a season, with all transfer fees adjusted for inflation (i.e. converted to 2018 money).
Like wage-bill analysis the £XI has always been a good indicator of where teams will end up in the league; the top six £XIs almost always comprising in the top six in the league these days, for example, if not necessarily in the exact order (although the top two last season were the top two £XIs, in order, and the league winner almost always comes from within the three richest clubs).
While wage-bill analysis is very handy indeed, one advantage of the £XI is that we don’t have to wait a year or more for clubs’ accounts to reveal their wage bills. We can get an idea of the squad cost and the XI cost as things stand right now.
So far this season Liverpool have moved back into the top four on £XI ranking, finally overtaking Arsenal, whose second season in the Europa League has started to dent their team funding. With regular Champions League runs and a new money-generating stadium, Arsenal were pulling clear of Liverpool; but on-pitch stagnation – at the time when Liverpool have got their act together at all levels of the club – has led to the Reds now being able to field a more expensive side.
As things stand, Liverpool should now be finishing above Arsenal, before looking at the additional context of cup runs, injuries, etc.
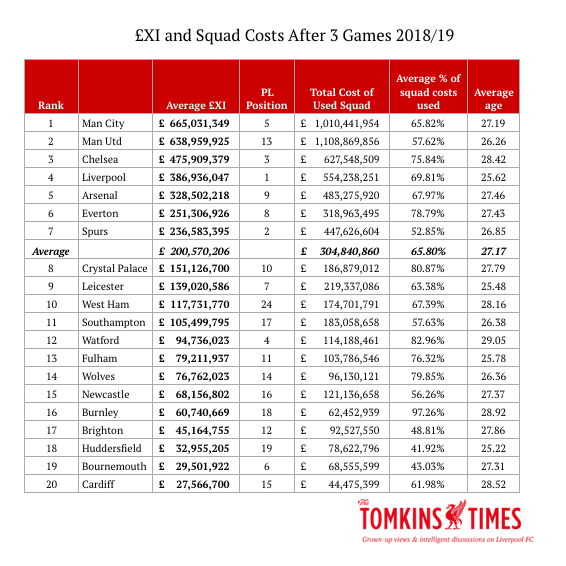
And incredibly, Everton’s spending spree currently has them above Spurs, who have fallen to 7th in terms of team costs, due to zero spending this summer.
Spurs consistently remain the best team, pound for pound, in the Premier League, and therefore winning trophies is not a fair barometer to use when judging their manager; just as you can’t expect Liverpool to win the title and blame Klopp if they don’t when the Reds still lag well behind the richest clubs.
(This is an odd phenomena: have your club punch well above its weight and then be blamed for not punching even more above its weight. It’s like me beating a professional boxer in a fight and you saying “yeah, but so what, he isn’t the world champion?”)
That said, Spurs have a costlier squad than Everton and in time that will surely affect future £XIs. As it stands, Everton have been getting almost 80% of their total squad costs into the XI, but that of course will change in the next three games (at least) with the suspension to Richarlison and the injury to Michael Keane.
But just look at how far Liverpool’s £XI is still behind the big two Manchester clubs, and even Chelsea. And look at the +£1billion squad costs at the Etihad and Old Trafford, based on players given match time in 2018/19. Liverpool’s used squad costs are literally half that of Man United’s.
Liverpool’s £XI will almost certainly grow higher than it has been so far, for the same reason that Spurs’ probably will; the squad costs mean that any changes to the XI are likely to increase the £XI, unless Jürgen Klopp bypasses his usual bench and promotes lads from the U18s.
Some of Liverpool’s costliest players when adjusted for inflation are Jordan Henderson, Dejan Lovren, Fabinho and Adam Lallana, none of whom have started a game yet. That said, only two of those would have been expected to be regular starters this season.
Lovren would have been the expected centre-back to partner Virgil van Dijk (but the young, outstanding and cheap-as-chips Joe Gomez is shining), and Henderson would have been expected to get a game in midfield; and if he didn’t, Fabinho was probably seen as the natural replacement. Probably no one outside of Melwood expected neither Henderson nor Fabinho to start a game yet, or for the latter to not even make the bench.
But as it stands, the captain was given a rest after the World Cup and Fabinho is being given the Alex Oxlade-Chamberlain and Andy Robertson treatment (reminiscent of the old Liverpool way) of time on the training ground and/or in the reserves used to adapt. And even then, Fabinho, at £40m, is cheaper than the inflated costs of Lallana and Henderson.
Pep Guardiola hasn’t thrown in all his expensive players at once yet, and the costly Kevin de Bruyne (a £119m transfer in 2018 money) is out for several months. While you can always get bargains, greater spending increases the odds of a stronger squad; City spent a huge amount on KdB, and rightly so. But losing such key players is also where advantages can be lost.
By contrast, Mourinho has been starting all his own biggest buys, particularly Paul Pogba and Romelu Lukaku; although he has also chosen to bomb out his own centre-back purchases. Mourinho’s title successes 12 and 13 years ago – titles he referred to this week in order to defend his record (but where the exact same achievements still had him call Arsene Wenger “a specialist in failure”) – has to be seen through the context of the time.
Remember, relatively speaking, Chelsea under Mourinho were the richest club in Premier League history, and possibly football league history. Their £XI was miles ahead of Man United’s, whose £XI was miles ahead of everyone else’s. So those title successes were built on dwarfing everyone else financially, and not just the supposed “specialness” of the manager.
Man City have never been so relatively rich, at just a fraction above what United’s £XI has been. And this Man United side is nowhere near as relatively expensive – judged against the closest competition – as Mourinho’s original Chelsea side was. Without the runaway biggest budget, Mourinho is rarely so effective.
Chelsea’s current crop cannot be written off this season, with those squad and £XI costs, and the quality and experience in the side. That said, they are fairly old at present, however, and you have to wonder how they’ll cope with the Europa League without much youth in the side right now.
Based on the first three games, Liverpool are the youngest of the Big Six, and the third-youngest team in the league; indeed, more than a year younger than Spurs, who are always seen as a young side.
Liverpool’s average age is currently 25.6, with Man United at 26.3, Man City at 27.2 (are they starting to pass their peak, or is it just that players like Leroy Sané aren’t currently starting?), Arsenal 27.5, and then come the Chelsea pensioners at 28.4 (good luck with the high-energy game over 10 months, Sig. Sarri!).
As soon as James Milner sits out a league game, Liverpool’s average age will drop yet further; no one else in the squad is anywhere near as old as him. And while you can have younger champions and older champions, Liverpool have the scope to improve more in the next 12 months than other teams based on the natural (but not guaranteed) career trajectories of teams and players.
As good as they’ve been, it’ll be hard for Vincent Kompany, David Silva and Fernandinho to get even better, and the greater probability – although again, not a guarantee – is that they will start to melt soon (Kompany may already be well on the way, based on some of his performances in 2018, and Fernandinho has to be a melt-zone worry after his busy past year at the age of 33). As such, City probably have a bit more of a transition on their hands this season than Liverpool, even if they have the squad depth to have it hardly be a crisis.
To put it into context, only Leicester in the past 15 years have won the league with an £XI below £585m in 2018 money, and right now, Liverpool’s £XI (£386.9m) is just between half and two-thirds that usual “minimum”.
Even allowing for a few extra points picked up with luck, City, historically speaking, had best English league team in the history of English football, and also had the pressure of leading from the front in 2017/18 (although it become such a big lead that it gave them a comfort zone; they were able to relax in the second half of the season, knowing that a defeat wouldn’t be fatal).
They have all that title-winning experience, and Liverpool have virtually none, as well as the hysteria of idiots like me desperate to end a wait that dates back to before all but one of the Reds’ current first XI was born. City don’t have the same weight of hysteria, and along with their bigger budget and “been there, done it”, has to make them favourites.
But Liverpool, as shown above, are a lot closer to them than a lot of people realise; and it is the Reds who, along with Spurs, are punching most above their own weight. Now Liverpool just need a bit more luck, and possibly a shorter run in Europe than Man City, and the once-unthinkable might just be possible.
)