Beez’s Monthly Column for The Tomkins Times
By Andrew Beasley (TTT Subscriber Beez). This article will refer to my expected goals system (the full explanation of which can be found here) and my stat benchmarks (which I explained in full here).
Liverpool find themselves very much in the midst of a title challenge this season, for the first time since their unforgettable 2013/14 campaign. You will all no doubt have a view as to which of the two sides is better, but I have taken an objective in-depth look at the stats to try to answer the question. We were all disappointed that Rodgers’ 2013/14 team couldn’t maintain their title challenging form thereafter; does Klopp’s team look like they are in better shape for long term success?
I thought I’d start with a look at expected goals, as that wasn’t such a widely shared concept in 2013/14, and certainly not after every match like you see now. The following graph shows how the net expected goal difference for each side has progressed throughout the season.
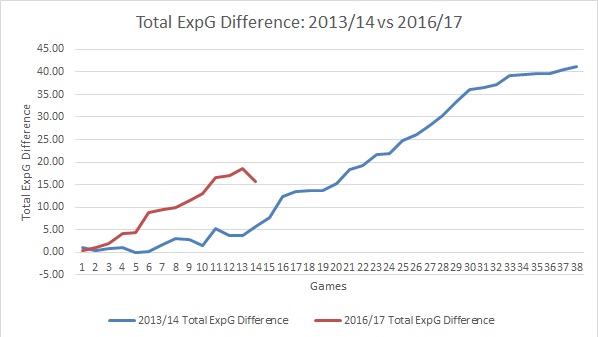
This year’s team certainly flew out of the traps compared to their predecessors. Prior to the recent Bournemouth debacle, Liverpool’s expected goals difference was 18.45, and Rodgers’ team didn’t pass that until match 22, against Hull City at Anfield. To put the opening fourteen games of this season into some kind of context, the 2013/14 team posted a difference of 25.79 for the spell book-ended by the trips to Spurs in December and Manchester United in March, so whilst the start of this season has been hugely encouraging, it’s still a long way short of the best that the 2013/14 could muster.
The rest of this article is for subscribers only.
[ttt-subscribe-article]