By Andrew Beasley (TTT Subscriber Beez).
Thanks to websites like whoscored.com, it’s common to see team or player statistics presented on a per game basis. We can then say how many shots a team who finishes in the top four averages (as an example) and see how another team compares to that.
I thought we could perhaps learn more about top level performance via stats on a game by game basis though, and with this in mind I collated shot, pass and possession stats for all 380 games in the Premier League in 2015/16, and using this data, I was able to investigate just how often various stats leads to wins*.
(*The results don’t include own-goals as I gathered the stats from Stats Zone who don’t include them in their ‘all stats’ page, so some of the results I have won’t match the actual score. For instance, Manchester United beat Spurs 1-0 thanks to an own goal, but this is logged as a 0-0 draw. Such games won’t make much difference to the findings, but you might see contrasting numbers elsewhere so I wanted to be clear).
Of the 274 wins in the top flight last season, here’s how many of them were won by the team that ‘won’ a particular statistical duel. I also included my own expected goals model (which you can read more about here), though of course models by other stattos will probably differ here.
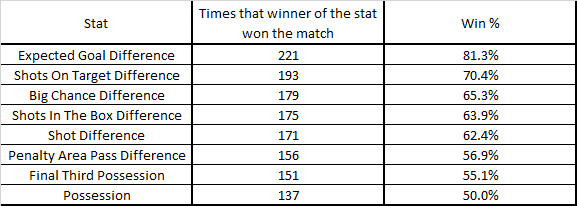
Perhaps everything we can see here is obvious, but it’s good to have figures for games from a whole season. Possession has a coin toss accuracy in terms of leading to wins; you can improve it slightly by looking at which team has the better of the respective final thirds, and then a little more by looking at passing in penalty areas, but the correlation is still relatively low.
Moving onto shots, all shots are the least well matched with results. As with passes, focussing on the shots in the boxes adds a little (though not much), and big chances (“situation(s) where a player should reasonably be expected to score usually in a one-on-one scenario or from very close range“) a small amount more. It’s shots on target though where we see the best result from raw stats though, and filtering them through my expected goals model improves the results further.
Why am I telling you all this? We can use this data to target Liverpool across 2016/17, that’s why.
The contents of the following table won’t surprise you, but they really emphasise the importance of a team creating far more top quality chances than their opponents.
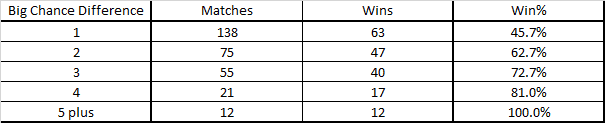
We can see here that the greater the big chance difference, the more likely a team is to win; no prizes for guessing that this would be the case. More importantly though, every time a team has three big chances more than their opponents, they win 72.7% of the time. If a team won that percentage of their league matches then they’d put 28 wins on the board and would be in with a chance of winning the title. Not only that, but sides only lose 5.7% of the time (as it happened on just five occasions) when having at least three big chances more than the team they’re facing, so this seems like a good target for Liverpool in 2016/17.
This target was met 88 times across the 380 games last season, so roughly a quarter of the time, but how often did Liverpool manage to have at least three big chances more than their opponents? Here are their figures for 2015/16.
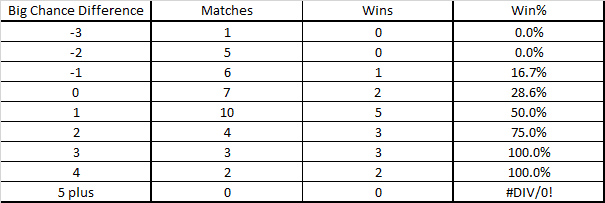
Thankfully it only happened to Liverpool once (at Vicarage Road, in a largely self-inflicted capitulation against Watford), but the Reds only did this to their opponents five times themselves. The threes were against Bournemouth, Watford (both home) and at Villa, with the fours at Anfield in the Merseyside derby and away at Manchester City.
For Klopp’s men to match the Premier-League average hit rate from last season, they will need to have three big chances more than their opponents nine times, so this will be the target for this campaign. For some context, champions Leicester City did this ten times, whilst Arsenal (the team who had the most big chances) did so on fourteen occasions.
Let’s look at the same league figures, but for shots on target difference.
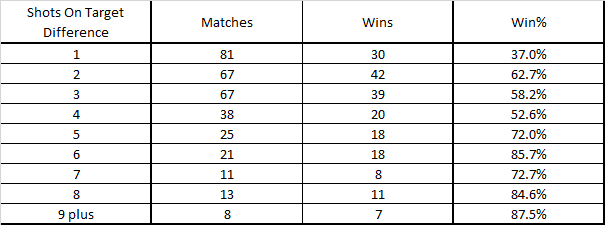
The win percentage here follows a far less linear progression than we saw for big chances, but then that stands to reason, as the true value of a shot on target varies greatly (as per my expected goals system) so having the odd one or two more than your opponent may or may not make much difference to your chances of winning.
What we can see though is that the figures are similar when starting at five and above as they were for three big chances or more. The win percentage is at least 72%, a team manages it 21% of the time, and teams beating their opponents by this many shots on target only lost four matches, or 5.1% of the time. This will therefore be the target for 2016/17, so let’s take a look at how Liverpool fared last season.
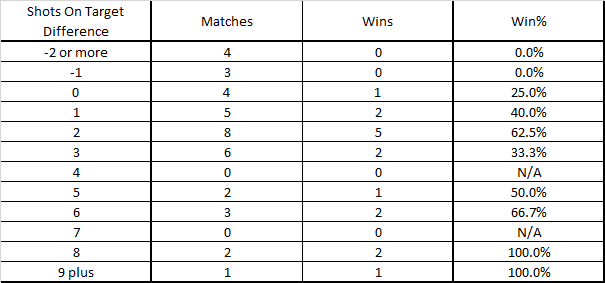
Liverpool met the league average for my benchmark target last season, as they had at least five shots on target more than their opponents eight times, and they won six of the matches too. The three teams that had more shots on target than the Reds last season had similar figures too; Arsenal matched Liverpool with eight, whilst Manchester City (eleven) and Spurs (twelve) were slightly ahead.
It’s interesting to note that Leicester only did this four times, but as they had a rock solid defence and the Reds certainly do not at present, I think we need to aim a little higher than that. I will set the target as ten, as it’s a nice round number and will show improvement from the previous campaign.
My intention is to monitor these stats, plus of course the figures from my new expected goals system over the course of 2016/17 and report the findings back in my monthly column, but I’m more than happy to take suggestions for other things to investigate. Please also feel free to ask any queries you have regarding the data too; if you’d like to know who had the most accurate passes in the penalty box, or who had the most shots in a Premier League game without scoring (as just two random examples that popped into my head) then please fire away in the comments below.