I’m sure by now you’re familiar with the concept of expected goals (or xG or ExpG for short). Each shot a team takes and concedes is assigned a value based on the historic likelihood of it being scored. I thought I’d get in on the act by making a system too, though more for my own interest than to revolutionise football analytics in even a small way (aside from perhaps opening it up to a wider audience by keeping it very simple), but before I talk about it any further, let’s be clear here: this is a very basic system, and in large part because it has to be.
I don’t have the skills to scrape and code data from websites, and neither do I have time to collate masses of data manually; now that I’ve put some hard yards in, I can maintain this database in about ten minutes per week. That will in turn free up time to write about the findings for you good people!
This model will have any serious statisticians running for the hills (and probably returning in my direction brandishing pitchforks), and by my own admission it is a long way behind the masters of this game; please seek out (in no particular order and off the top of my head) the likes of Michael Caley, 11tegen11, Paul Riley and Ste McCarthy for starters if you’re after a more accurate and/or more detailed system. My system is based only on shots on target, and the aforementioned Paul Riley has been doing likewise for years so I bow to him on this. As I’ve said, this is a simple system for a simple man.
There is no differentiation in this system between headers, shots from feet, set-pieces, through balls, corners, direct free kicks, Icelandic long throws (and there’s a topical reference which will no doubt soon be dated) or any other shot type or creation method you care to mention. The shots are simply divided into four locations, with a couple of additional categories for high probability shots included too. Here are the categories and their expected goal values, which I calculated using the 3,231 shots on target from the 380 games in the 2015/16 Premier League.
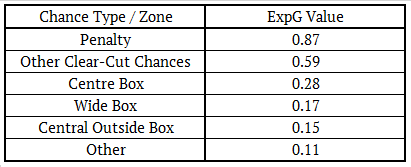
We can immediately see from the numbers here how a simple system like this provides more insight than basic shots on target numbers, as all shots on target were worth 0.305 goals on average in the Premier League last season, when in reality there is a wide variety of expected goal values. This obviously isn’t a revelation, but it’s very important to remember nonetheless.
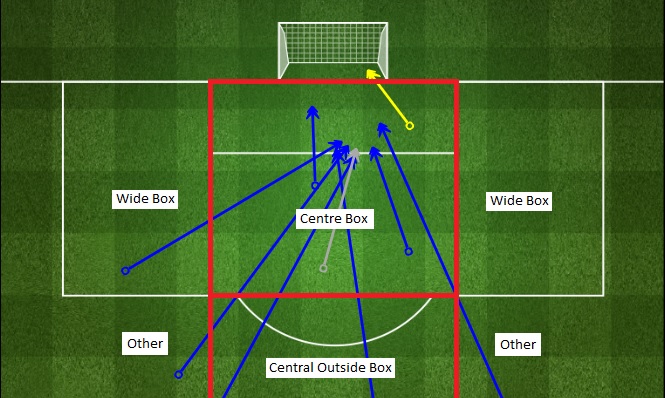
For those of you who prefer a more visual representation of the shot zones, here is an example shot map from Stats Zone for Liverpool in their 1-1 home draw with Chelsea. You can see where the four main zones are, penalties would be obvious (there isn’t one here), and clear-cut chances are a subjective stat (albeit one with definite merit, as demonstrated in the difference in conversion rate between them and other shots) so they don’t have a zone as such.
So off you go; you now know the values of each type of shot, so you can easily assess any match you haven’t seen using this simple system and have a reasonably good idea of who should’ve won. Let’s see what we learned via the data I compiled.
Consider the following: You might look at the raw shot difference stats for last season and conclude that Leicester City were remarkably lucky to finish top, as they were ranked tenth for shot difference, and only averaged 0.1 shots per game more themselves than they allowed their opponents. They only had the sixth most shots on target in total, whilst allowing their opponents the sixth fewest, and 34.2% of their shots were on target against a league average of 33.1%, so there was no major edge gained there.
Yet using my system, Leicester City were ranked fourth for expected goals difference, suggesting they deserved to be in the mix at the top end of the league, if not outright champions. I thought it would also be interesting to look at how many times each team won the expected goals battle (so had a higher expected goals total than their opponents), and ranking the teams this way placed Leicester third. I have sorted the teams here by the net figure of ExpG wins minus ExpG losses (as there were no draws!).
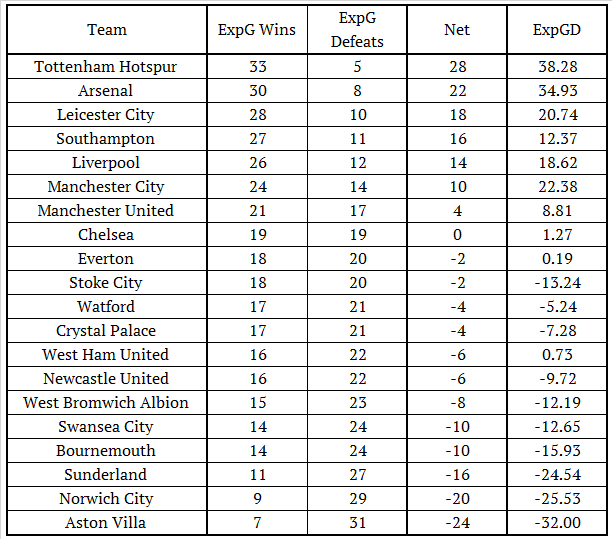
It’s interesting to note here that although Liverpool’s ExpG difference per game last season was 0.33 under Rodgers and 0.53 under Klopp, the German’s ExpG win percentage of 70% (up from 63% for Rodgers) wouldn’t move Liverpool up the above table if extrapolated over a whole season. Even so, if Klopp’s team “deserved” (using this system) to win 70% of their matches despite him not buying the players and the club phoning it in for a couple of months as the Europa League took precedent, then hope springs eternal that 2016/17 could see the Reds make a decent run at the top four.
One area where Leicester certainly had the edge over Spurs was in terms of what I am deeming lucky wins and unlucky losses. This is where a team has won or lost the expected goals battle in a match, but had the opposite result in reality. Of the 272 matches that were won in the 2015/16 Premier League, only 51 of those were won by the team that lost the ExpG match up. Here’s how those were distributed amongst the teams, and they show how West Ham were able to finish seventh in the league table despite only ranking thirteenth in the above table of net expected goal results.
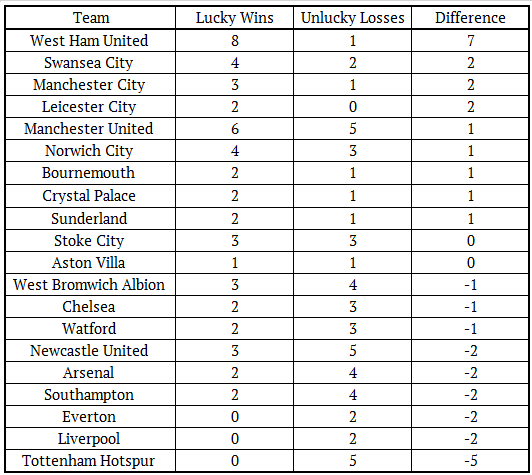
Tottenham Hotspur lost six games in the league last season, yet on my system they should’ve won five of them. Their first match of the campaign illustrates this well, and also highlights a flaw in my system; Spurs lost 1-0 to Man United to an own goal, which obviously had a massive effect on the result but won’t be picked up when using a shots on target approach. Tottenham’s undeserved losses obviously had a massive impact upon the destination of the league title.
In case you’re wondering, Liverpool’s two unlucky defeats were against Manchester United at home (typical!) and Southampton away. You can’t rely on things becoming even over time, but the Reds were one of only three teams without a single undeserved win all season, so it’d be nice to see that swing back the other way in the next campaign.
Expectations in terms of goals are one thing, but the odds of a team matching that exactly must be miniscule, so let’s see how the twenty top flight teams performed against their ExpG tallies at each end of the pitch last season, starting with the attack.
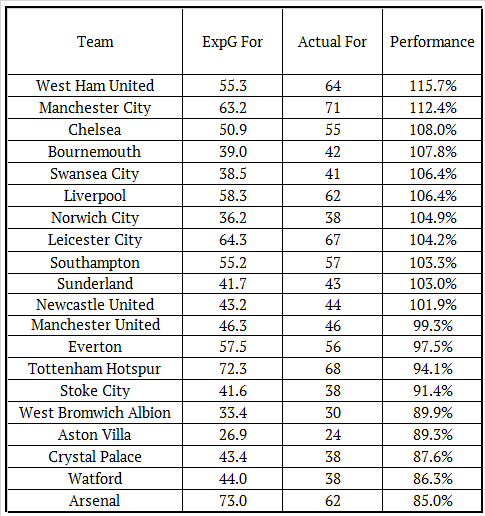
There’s clearly more evidence here of why West Ham did as well as they did this season, though equally Manchester City should’ve perhaps done better? Meanwhile the bottom of the table must leave Arsenal fans wondering what might have been; more goals don’t automatically lead to more points, as who knows in which games they’d occur, but even an average level of finishing would’ve seen them score nine more goals, which would have given the Gunners the most goals scored and best goal difference in the division. Maybe the title too? Let’s see how the defences fared.
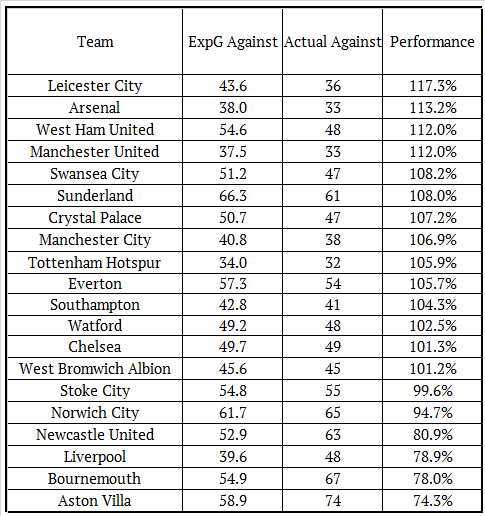
From the data I have collated, this appears to be the biggest reason as to why Leicester managed to win the title, and once again we can see West Ham were up at the top end for overachieving. As for Liverpool, well, I think we can see why Jürgen wanted to get a new goalkeeper. The good news, as I explored in more detail here, is that Loris Karius’ performance last season would put him in the top three in this table (and I can’t be more specific than that as I had to use Premier League data to calculate his figures, not Bundesliga numbers, so it’s hard to say exactly how he’d have done in England).
The key thing to notice is that only three teams allowed their opponents fewer expected goals than Liverpool did last season, so as long as Karius is even a league average ‘keeper (though my research suggests he’s far better than that) then Liverpool’s defensive record could easily improve quite significantly.
Let’s combine the two tables together to see who gained the most goals overall when compared to their expectations.
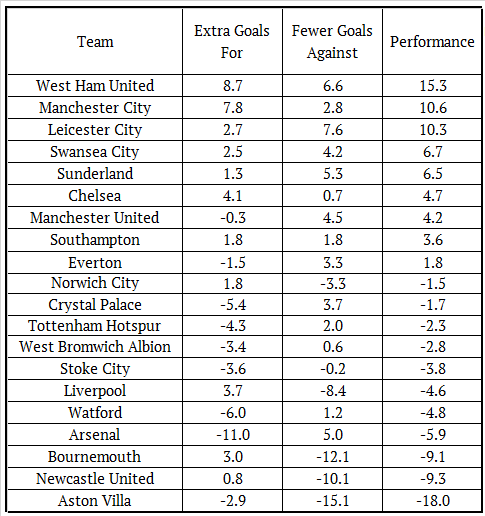
If I were Pep Guardiola, I would be looking at data like this and pondering what kind of job I now have on my hands. The City players no doubt slacked off once it became clear that Pellegrini was going and the title was out of reach (and of course, this system only assesses shots on target), but to outperform their expected goals figures by this much with a squad of that quality and value and still only scrape fourth place on goal difference? I would suggest there’s perhaps plenty of work to be done for them to justify their position with the bookies as title favourites, however good a manager Guardiola is.
Let’s take a much closer look at Liverpool’s record. Here’s how they fared in each match of the 2015/16 league season (though please note they are listed in the order the fixtures were originally scheduled, so rearranged matches are out of position):
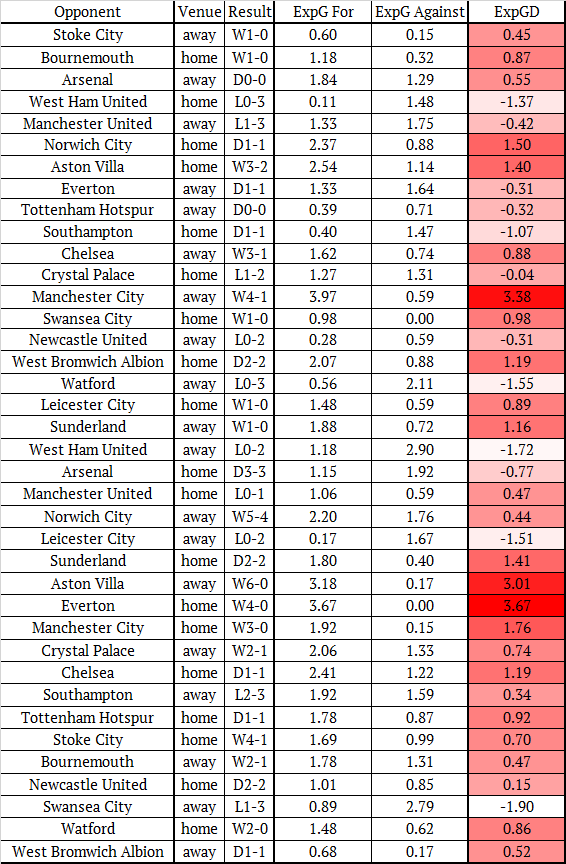
I find it very encouraging for the future that Liverpool were only bettered by their opponents twice in their final seventeen games. Both were away from home, with one against the eventual champions and one with a shadow squad in the weekend between the two legs of the Europa League semi-final. Granted, the Reds were bettered in seven of the thirteen games before that, but then Klopp has to be allowed some leeway in those as he was taking over mid-season. Once he was up and running, his Liverpool side were performing well under this metric.
The following table shows how the Reds fared against each team when the home and away matches are combined.
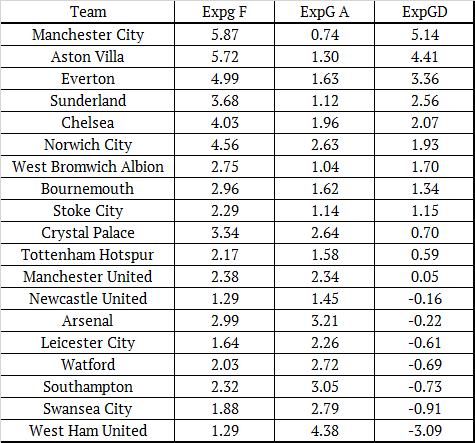
It’s no surprise to see that Liverpool performed well on this metric against the likes of the woeful Aston Villa and also Everton after one of the strangest, most one sided derbies ever, but to so thoroughly dominate Manchester City to the tune of 2.57 ExpG per game (when the best sides only win each match by around one expected goal per game on average) is remarkable, and there was an own goal at the Etihad on top of these figures too.
Looking to Liverpool’s main regular rivals, it’s good to see that only Arsenal bettered the Reds here, and not by much, though Jürgen Klopp will certainly want better performances against the bottom four sides in the above table in 2016/17. West Ham aside though, Liverpool were no worse than one goal down across two games against every one else, which is something.
I’ll be finishing with a look at finishing. Here is how every player who had a Premier League shot for Liverpool last season (plus Sadio Mané, for obvious reasons) performed against their expected goal totals, and obviously the vast majority of players had tiny samples so this is more for your information rather than to prove or disprove anything.
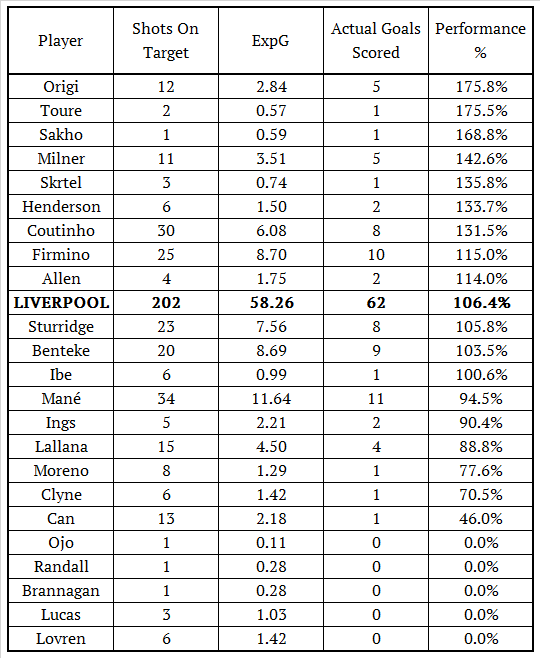
You’d have all assumed Benteke was below the performance average for the team as a whole, but Sturridge too? Liverpool’s new boy Mané basically performed at par, with 11 goals from 11.64 ExpG but had he not missed a penalty against the Reds (or not taken it at all) then he would be above the 100% average line and not below it. Small margins, and all that.
It was definitely a season of two halves for both a couple of important attacking players and the team as a whole. Roberto Firmino’s performance score for 2015 was 36% as he scored just the one goal, but for 2016 it was a whopping 153%, and Adam Lallana was at 151% from the away game at Norwich until the end of the season, but was 0% before that.
The match at Carrow Road seems to have been the turning point for the team’s attack as a whole, as the following table testifies.
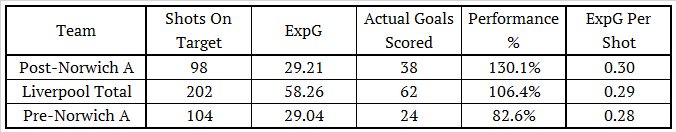
The total number of shots on target and expected goal total didn’t change that much, yet the goal scoring performance improved markedly. This may just be random variation, and I guess Firmino finding his feet and contributing so much more in the second half of the season will have had quite a large impact here; almost a third of the goals from Norwich away onwards (11 out of 38) were either scored or assisted by the Brazilian.
I hope you’ve found this interesting, this is the first time I’ve written about my ExpG system so all feedback and questions will be gratefully received. I will be using this system to assess how the Premier League shapes up and looking in-depth at how Liverpool are performing across the 2016/17 season. If you have any ideas for things to look for or interesting ways to use the data then please let me know in the comments below.