By Dan Kennett.
I will try to put the performance of Liverpool under Brendan Rodgers into context using three sources of data:
- Traditional Premier League table analysis from statto.com starting with Houllier’s 82 point 2nd place in 2001/02
- Comparison of results in all competitions with the other managers since the 2008/09 season (using data from LFC History) – Liverpool’s 2nd best season ever in terms of Points Per Game (PPG)
- More specific Opta metrics analysis from EPL Index from 2008/09 onwards
Why start with 2008/09? Well, because it represents the pinnacle of on-pitch performance in recent years. I say on-pitch because in the same year Liverpool produced its best and most consistent footballing performance in 20 years, the ruinous ownership of Tom Hicks and George Gillett produced the worst off-pitch performance in the club’s history, with a pre-tax loss of £54.9m. Never has the old saying “the fish rots from the head down” been more appropriate as the debt and instability ended in the high court and four managers in four years. To conclude a short introduction on the off-pitch background, it’s worth quoting the doyen of football finance analysts @SwissRamble . In his excellent review of Liverpool’s 2010/11 financial results (year 1 of FSG), he estimated that the self-inflicted damage of the Hicks & Gillett era totalled almost £300m (his rationale can be found in the post). Unfortunately, any on-pitch analysis of recent Liverpool performance has to acknowledge this.
The purpose of this post is to look at whether Liverpool has been through the on-pitch nadir or if the team is still declining, even if post-08/09 is a very fallow period in the club’s history and any improvement is relative.
1) Premier League Only
Attacking
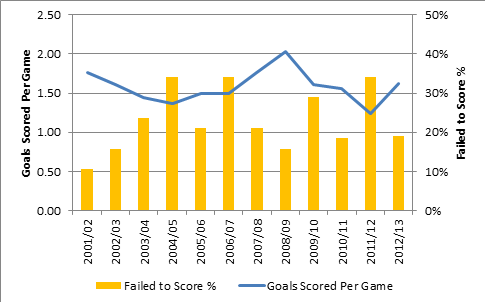
This is the one generic area where Rodgers outperforms the 12 year average. In terms of goals scored, only three seasons better this season’s 1.62 goals per game (the two seasons we finished 2nd plus 07/08)
Rodgers also performs well on “% of Games Failed To Score”, current season is 19% and only four seasons can better it.
Defending
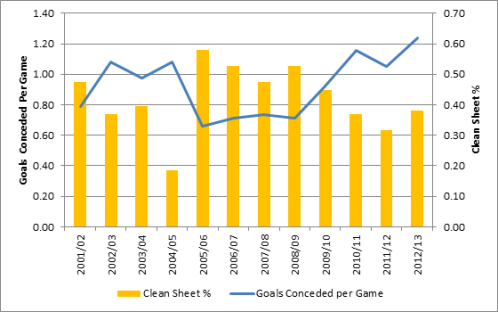
Firstly, it’s Goals Conceded Per Game. The current season of 1.24 is easily the worst in Liverpool’s recent history and 0.31 goals per game worse than the average.
Clean Sheets is slightly better though, even if it’s way below the typical 50% seen in the Benitez era. Current season is 38%, better than only four recent seasons, but at least the best since 09/10.
Results
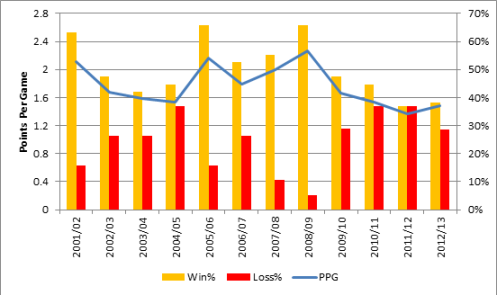
As has been endlessly debated since September, Rodgers’ main problem is that his Liverpool simply aren’t winning enough league games. His 38% win percentage is way below Liverpool’s recent average of 50% and beats only Kenny last season (37%).
His Loss % is a lot better though, at 29% just 4% higher than the average and the best since 2008/09.
Overall, in terms of Points Per Game (PPG), too many draws and not enough wins means that this season’s 1.48 beats only last season (1.37).
The 2008/09 season was pretty remarkable for Liverpool Football Club, even if it didn’t result in that elusive Premier League title. In terms of PPG it remains Liverpool’s 2nd best season ever, behind Bob Paisley’s 1978/79 vintage, widely regarded as Liverpool’s best ever team.
The rest of this article is for subscribers only.
[ttt-subscribe-article]


