By Finnish TTT subscriber Aki Pekuri.
Many of us believe we have been unlucky this season. The woodwork has been tested as frequently as the net, and when shots did arrive, keepers from the opposing side have made world class save after world class save to keep us frustrated. (Just see the Match of the Day saves of the season compilation.)
But what is luck? Luck always comes into question when something unlikely happens and, depending on which side of the mean we are, defines its goodness or badness. This piece is about luck and how to stay out of its bad influence.
(Liverpool hit the woodwork twice in the League Cup final, and missed two penalties – but on this occasion it wasn’t costly.)
The mystery of luck is approached using Poisson distribution in analysis. Wikipedia defines Poisson distribution as “a discrete probability distribution that expresses the probability of a given number of events occurring in a fixed interval of time and/or space if these events occur with a known average rate and independently of the time since the last event”.
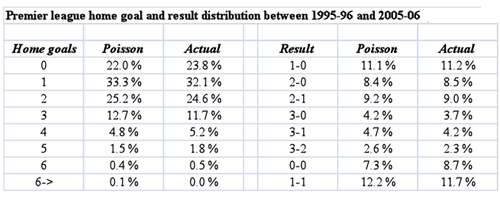
Poisson is very good at predicting different outcomes in football when we know the above mentioned “known average rate”. The first table (below) demonstrates its accuracy by using ten year Premier League data between 1995-96 and 2005-06. Known average rates here are the averages of goals scored per game for home (1.51) and away (1.10) teams during the period. To save space only the distribution for home team goals is presented. Probabilities of different results can be calculated by simply multiplying all the different outcomes.
Poisson is not 100% accurate without some modifications which are mainly country and league specific. In some leagues there are, for example, more draws than the Poisson predicts which could be taken into account to improve predictions. Here just the standard Poisson is used and as can be seen from the above table, results have about 2% confidence interval when the average rate is known. The problem here is that the known average rate is not available. Thus, a model was created to form average goal scoring rate for each team.
At first, data for each Premier League team was compiled to present games played, goals scored (including all types of goals), clear cut chances, clear cut chances scored and (total) chances created. Data shows that after 26 rounds (bar Merseyside derby) there have been 907 clear cut chances with 39 % conversion rate, so one CCC equals 0.39 goals scored. In addition to CCCs there are “ordinary chances” and ordinary goals, that are left from total chances and goals scored after CCCs and goals scored from CCC have been reduced. Average conversion rate in the league for this kind of ordinary chance (OC) is 8%, ie 0.08 goals scored per created OC.
The next table shows total chances created, ordinary chance conversion rate, clear cut chances, clear cut chances scored and clear cut chance conversion rate for each team.
The rest of this post is for subscribers only
[ttt-subscribe-article]

