By Andrew Beasley
Firstly, a couple of important points. I realise showing that Rafa did better last year than Roy has this year is a no-brainer. It’s also far too early to apply any serious statistical analysis to Roy’s tenure. However, I thought I’d share some stats I have researched in order to try and illustrate how much they differ so far. These apply to league games only:
What we can see from the above figures is that Liverpool are scoring first less, and conceding first more. Not a good way to evolve. As it’s fair to say that Roy has been dealt some of the more difficult matches he’ll have to face during the first eight games, I thought I’d also compare his stats with the corresponding fixtures from last season. [Although, on paper, with two home games against promoted teams, the balance is actually fairly equal in terms of overall opposition quality.]
I have had to replace Blackpool with Burnley (previous season’s play-off winners) and West Brom with Birmingham (promoted as 2nd in the Championship) for Rafa’s figures.
I have to point out that in two of the seven games where Liverpool scored first last season (Arsenal home, Manchester United away) the Reds lost the match, so scoring first isn’t the be all and end all when it comes to getting results.
But it doesn’t half help most of the time.
I’ve also broken it down into an average timing for each. This table includes the whole season of 2009-10 for Rafa:
This is for the ‘matching’ eight fixture that Roy has had:
From eight league games so far this season, Liverpool have mustered just one solitary first half goal. If you asked Steve Bruce (and we won’t), they wouldn’t even have that, as it was the controversial first goal against Sunderland. By comparison, Rafa’s Liverpool scored eight first half goals in the exact same fixtures, and in two games (Sunderland and Burnley at home) they had scored two by half time; a long way towards securing the points.
Add to this that there have been five first half goals conceded so far this season, and only two clean sheets overall, and it becomes apparent that Liverpool have big problems at the moment defensively too. Liverpool’s percentage of league clean sheets is currently 25%; Rafa managed 45% for the whole of last year, and 50% for the same eight games as Roy has faced so far.
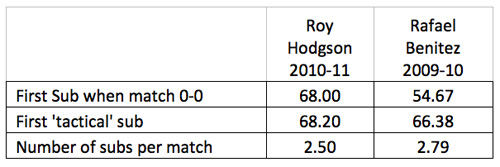
Regular readers will know I keep a record of substitution timings after researching an article for this site earlier this year. But I’ve devised another stat since then – time of the first substitution when the match is 0-0.
Everyone (without any access to any actual statistical research) knows that Rafa never made a change before 65 minutes in a match. Well, last season he tried a change when the match was 0-0 after 54.67 minutes on average.
Media favourite Roy Hodgson, on the other hand, hasn’t intervened until 68 minutes have passed in matches that are deadlocked and goalless, though in fairness this has been only two games so far. (Perhaps more worryingly, changes when the Reds have been losing have also been left late.)
He also makes fewer changes, and makes his first ‘tactical’ (e.g. not including forced substitutions due to injury that occur in the first half of matches) slightly later on average. This seems to back up what one poster on this site had heard from a Fulham fan friend of his – with Roy, it’s Plan A all the way.
This isn’t intended to be a fish-shooting-in-a-barrel exercise, and I desperately want Roy to do well, because it will mean Liverpool are doing well. But knowing that people who read this site are interested in statistics and how they often disprove perceived media wisdom, I thought I had to share what I had found.
In many ways you can make what you like out of these stats, as they’re based on small samples, and Rafa probably had certain advantages over Roy (e.g. the fact he had more of his own players in the squad and they were more accustomed to his tactical plans etc), but the one statistic that matters most is this – results from the comparative eight league games:
Rafa – Won 3, Drawn 3, Lost 2, For 14, Against 7, Points 12.
Roy – Won 1, Drawn 3, Lost 4, For 7, Against 13, Points 6.
Grim reading indeed.
Thank you to Andrew for providing this piece.
What follows now is my take on another major problem with Roy Hodgson that the media did not foresee.
[ttt-subscribe-article]


