TTT subscriber Tim Godden takes a look at the misfiring Liverpool striker’s record in his first 16 games of each season since arriving at Liverpool.
This season has seen a great deal of criticism levelled at Fernando Torres; he has been disinterested, he is off the pace, he is not committed, ad infinitum, ad nausaeum. Surely this cannot all be media sensationalism?
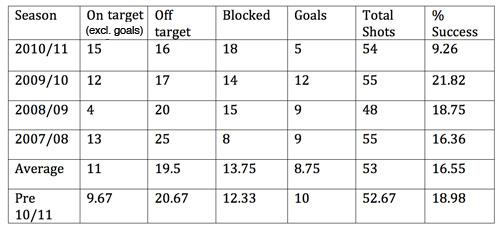
Torres certainly looks to have cut a dejected figure at times during the first sixteen games he has played this season. How has his involvement differed this year to the same period of time in previous years? The table below is a breakdown of Torres’ primary function on the pitch in his first sixteen matches of each of his seasons at Liverpool.
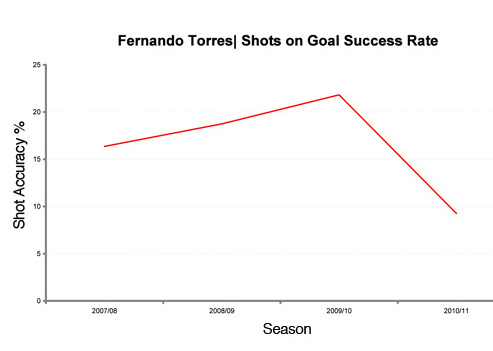
There are two very clear factors that emerge from this study; this season Torres has scored fewer goals that at any other point in his Liverpool career after sixteen league matches; his involvement in the game in terms of shots on goal has been consistent through every season. The upshot of these two factors are that Torres’ success rate has dropped from a better than 5:1 shot to goal ratio to a worse than 10:1. The table below shows that year on year, until this season, there has been a steady increase in Torres’ success rate in front of goal.
In other words, Torres has been as active in front of goal this season as any other, in terms of attempts, the only and, ultimately most important difference has been in the final product. What is the reason for this?
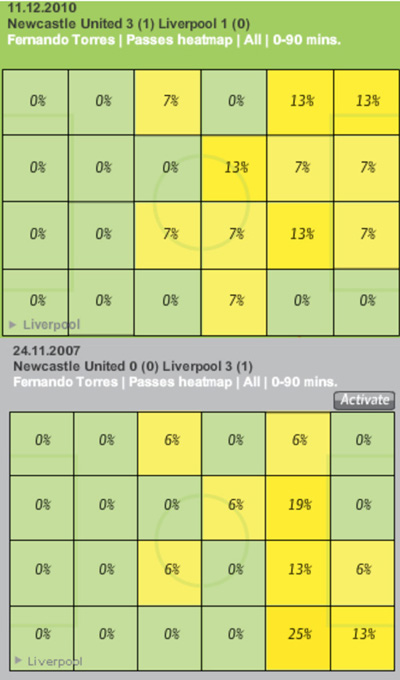
Torres’ body language has been used as an indication, but this can be far too subjective to analyse the reason behind not scoring and, as such may or may not infer any inner turmoil the striker may be suffering from. In an attempt to understand the possible problem I have compared his role in last Saturday’s game against Newcastle with the last time Torres appeared in a match against the same opposition also at St. James’ Park. This was during his first season, at a similar time of year by coincidence. The match to be compared took place during his much talked about ‘explosion’ onto the Premiership scene. Whilst not as good as his figures in the following two seasons, show a success rate of around 5.1:1, though his current best first sixteen games in a season was the 4.7:1 achieved in 2009/10.
Rather than use the shots on goal to solely analyse Torres’ play a key indicator is the heatmap of his passing, a sign of his wider involvement in the game.
It is evident that Torres was occupying a position on the pitch more permanently near the opposition goal. Indeed, whilst he did not score in either of these games, the heatmap for the 24.11.2007 represents a trend that can be seen in most games that Torres manages to get on the score sheet, a high percentage of involvement in the final third of the pitch. This can be seen in the totalled percentages of passes made in the final third in 2007, 82% compared with the 60% of last Saturday’s fixture.
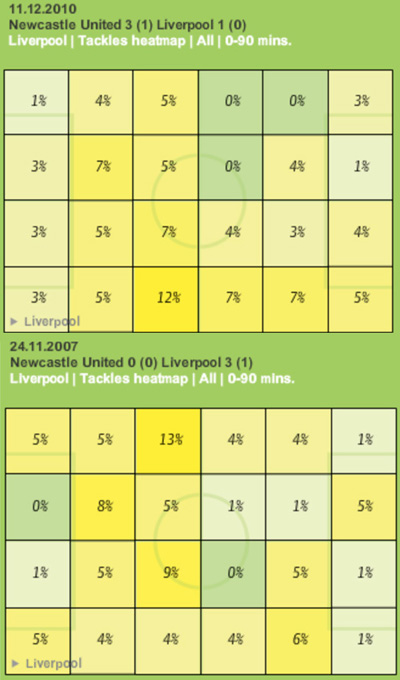
The two heat maps are a clear sign that the tactics adopted in the 2007 game used a more attacking approach that allowed the striker to adopt a position higher up the pitch. He is, therefore, more often in a position to take effective shots on goal. To support this point the following heat maps identify the number of tackles made by the whole team across the pitch.
There is a clear heavier weighting to the tackles made nearer to our own goal in Saturday’s game than in the 2007 game, a cursory glance at other fixtures at St. James’ between the two clubs show this even more so.
Tactically, as has been mentioned in previous TTT articles, Roy Hodgson has employed two ranks of four, nominally a defence and midfield, that effectively play either side of the 18-yard box for most of the game. It is only natural then that the tackles are made further back. The effect this has had on Torres’ game is that he now has to retreat further to receive the ball and is removed from a position of threat on the field by doing so.
[PT: Read this quote from a Guardian article from 2009: Barcelona’s strikers have committed more fouls than any of their defenders, Dani Alves apart. According to Johan Cruyff – Dream Team coach, Barça ideologue and the man whose philosophy Guardiola admits trying to emulate – pressuring high limits the amount of running players must do. When you win back the ball, he explains, there are 30 metres to goal rather than 80. “I want Messi as far forward as possible,” Guardiola adds.]
In very simplistic terms, Torres is having more or less the same level of involvement in a game as in previous seasons. What is different this season is that he is no longer playing in and around the opposition penalty area but in and around the gap between the centre circle and the eighteen yard box. It is not a case of a lack of fitness, nor being disinterested in a game, nor any other of the myriad reasons that some sections of the media claim to have reduced his potency in front of goal this season (though some may a part to varying degrees). What is undeniable is that Torres is not scoring as many goals because Roy Hodgson’s tactics put him in a position on the field that reduces his chance of scoring by 50% over previous years.
In stands to reason, the further a player is from goal (including being reduced to shooting from distance) the less likely he is to score.
