By Paul Tomkins.
A handful of years ago I joined forces with Graeme Riley to create the Transfer Price Index – a way of looking at how football inflation (which we discovered runs much, much faster than standard inflation) affects transfers. From this we worked out the “real” cost of squads and XIs.
We then identified a strong correlation between what we called the £XI – the average cost of the XI over 38 games – and league finishing position. Maybe that’s no surprise – although it never hurts to remind people that money buys a greater chance of success – but it was more accurate at predicting true positions than when looking at the cost of the squad.
Squad cost is like a club’s wage bill, in that it indicates how you’d expect a team to perform based on its entire resources (i.e all its players), but the £XI explains what level of talent (and/or expenditure) actually made it onto the pitch; in other words, the total Utilisation. Like any model, it’s not perfect, and there are always outliers, but it tends to work pretty well.
Of course, having an expensive squad means that injured players are often replaced in the XI by costly reserves. Alternatively, some clubs have a player who takes up a huge chunk of their overall budget; see Andy Carroll, whose transfer fee is a third of West Ham’s entire squad cost. Given his injury problems in recent seasons, you have to say that it was a big gamble for Sam Allardyce to take.
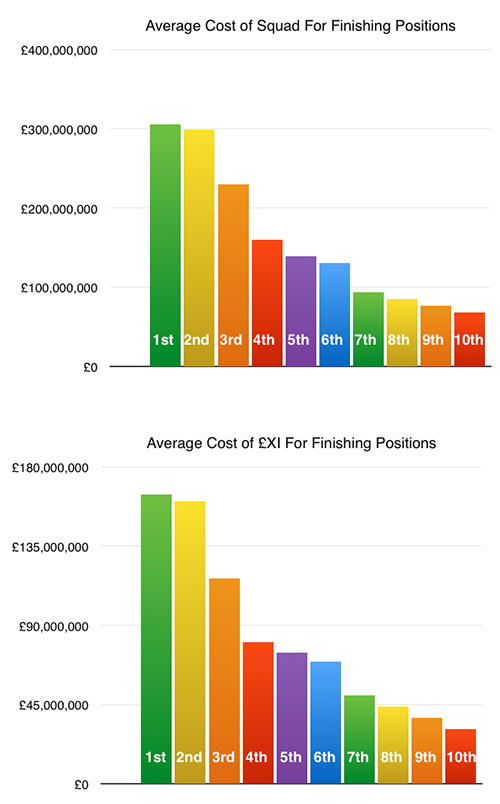
For anyone who still doesn’t believe that money plays a key role in determining where a club finishes, look at the following two graphs. They detail the average squad cost (the top graph) and the average £XIs (the bottom graph) for each finishing position since the turn of the millennium. (This being the point where squads started getting larger, and just before Roman Abramovich pitched up.)
While there are almost always clubs that under and over-perform in any given season, the 13-year average shows a perfectly descending scale, from 1st to 10th, in terms of money spent on the squad, and the cost of those who made it onto the pitch. (Remember, all the figures are converted to 2013 prices.)
As the graphs show, the average ‘cost’ of the top two is well ahead of that of the team finishing in 3rd place, and then there’s another big jump down to 4th. From then on, it’s a fairly steady drop. But all ten places are staggered, like descending stairs.
The first aberration occurs in 11th place, which, on average, cost more than 10th. The lower half of the table is far more of a jumble, whereas the top ten follows a set pattern.
Aston Villa are an interesting example, in that just four seasons ago they finished 6th with an £XI of £77.6m, which was the 7th highest in the Premier League. (Incidentally, 6th-highest was Newcastle, who were relegated; the worst performance since Hodgson and Kidd’s Blackburn a decade earlier.) So far this season Villa’s £XI is just £22m; less than a third of what it was just a handful of years ago. That would now rank them 12th in the Premier League; their actual position is 11th, so within one place of expectations.
Liverpool achieved the two ‘best’ runners-up spots this millennium in terms of the cost, with Houllier’s 2002 side having an £XI of just £77m, although this was pre-Abramovich, before the rules were changed; the second being Benítez’s £102.7m in 2009. Both of these were ‘cheaper’ than Arsenal’s 2001, 2003 and 2005 £XIs, that were marginally higher.
The last team to win the title with an £XI below £160m (remember, this is all converted to 2013 money) was Arsenal in 2004. In current day money, the first four champions of the millennium – Arsenal twice, United twice – all had £XIs under £122m.
Then Abramovich arrived.
Since then, the £XI of the title-winners has not fallen below £161m, with the average since 2003 rising to £191m. It’s great credit to Wenger that the current £XI after 21 games, as his side lead the table, is just £96m. However, my guess is that they will fall below the mega-squads of City and Chelsea as the demands of the season begin to take its toll.
Just three teams this season have an £XI in excess of the £161m mark that the champions usually require: Chelsea, United and City, in that descending order. Those three are more than £70m ahead of any other Premier League club in terms of this season’s £XI, and their squad costs are each a staggering minimum of £160m more expensive than anyone’s outside the trio.
In other words, the ‘big’ three’s squads cost the average price of a title-winning XI more than even those of Arsenal, Liverpool and Spurs; and that latter trio have £XIs that cost at least twice as much as those of Everton and Newcastle, the teams below them in the £XI rankings.
The second half of this article, which looks at the way this season is unfolding in terms of what teams (including Liverpool) should be achieving, including cost-per-point, is for Subscribers only.
[ttt-subscribe-article]

