Some statistics are obvious to the naked eye. You can debate whether Trent Alexander-Arnold’s assist for Sadio Mané against Atletico Madrid was a cross or a shot, but on the whole things that happen on the ball are pretty easy to determine.
Off the ball? All the best. It’s not that the data isn’t out there, far from it. What exactly different providers are collecting and sharing can be somewhat hard to determine though.
On the afternoon of December 16th, Statsbomb’s figures stated that Liverpool have made 682 pressures in the attacking third this season, without divulging how many were successful. Meanwhile Opta list the Reds as having made 185 high turnovers, which are our old friend the final third regain. With Anfield Index collating their own data too, it’s no wonder Daniel Rhodes of this parish recently posted an interesting Twitter thread looking at how their pressing figures offer context which Statsbomb’s do not.
And so on. But if we want to look at Liverpool and the Premier League for the entire Jürgen Klopp era, then PPDA – Passes Per Defensive Action – is our only option. It was created by Colin Trainor in 2014, and in an article he wrote about it for Statsbomb, he provided this definition:
The PPDA metric is calculated by dividing the number of passes allowed by the defending team by the total number of defensive actions (tackles, interceptions and fouls); both values will be calculated with reference to a specific area of the pitch.
PPDA = Number of Passes made by Attacking Team / Number of Defensive Actions
A smaller PPDA value signifies a greater level of defensive intensity, as in essence, the defence has allowed a smaller ratio of uncontested passes to be made.
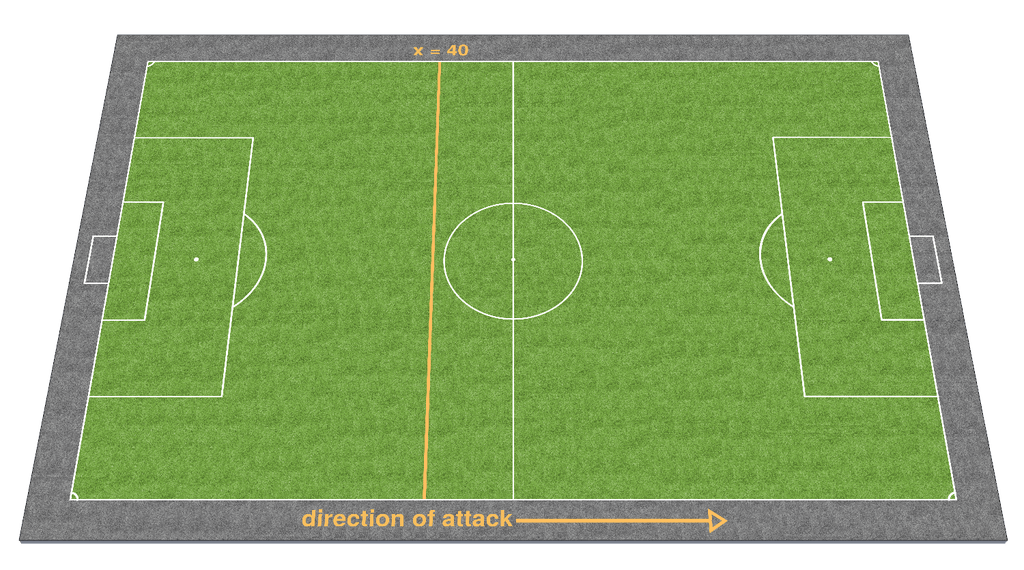
Here’s the specific area of the pitch which is relevant:

With the level of pressing data that’s available now, nobody would describe PPDA as the most all-encompassing metric, but neither is it not without merit or interest.
I wrote about it in the summer of 2018 for TTT, and as that was (very roughly) half way between Klopp’s appointment and now it seems a good time to revisit PPDA. But this chart, which was shared in the last data viz round-up and shows how Premier League teams’ figures have changed from last season to this, has also generated plenty of interest.
The rest of this article is for subscribers only, so sign up for £5 as month
[ttt-subscribe-article]