
Understat is best known for being a good public source of expected goal data, but xG is not the only statistic they carry. The site also has ‘PPDA’, which is Passes Allowed per Defensive Action. In simple terms, it is a measure of how fiercely a team presses their opponents. As Jürgen Klopp has famously said “no playmaker in the world can be as good as a good counter-pressing situation”, it should be illuminating to see how Liverpool fare for pressing, and which players were involved in the best performances.
To be clear, Understat did not invent this metric, though they are the first to share the figures to the best of my knowledge. Colin Trainor created PPDA back in 2014, and wrote an article about it for Statsbomb. To borrow from that piece to explain how PPDA is calculated:
The PPDA metric is calculated by dividing the number of passes allowed by the defending team by the total number of defensive actions (tackles, interceptions and fouls); both values will be calculated with reference to a specific area of the pitch.
PPDA = Number of Passes made by Attacking Team / Number of Defensive Actions
A smaller PPDA value signifies a greater level of defensive intensity, as in essence, the defence has allowed a smaller ratio of uncontested passes to be made.
The area of the pitch which is used to calculate the metric can be seen on the below map.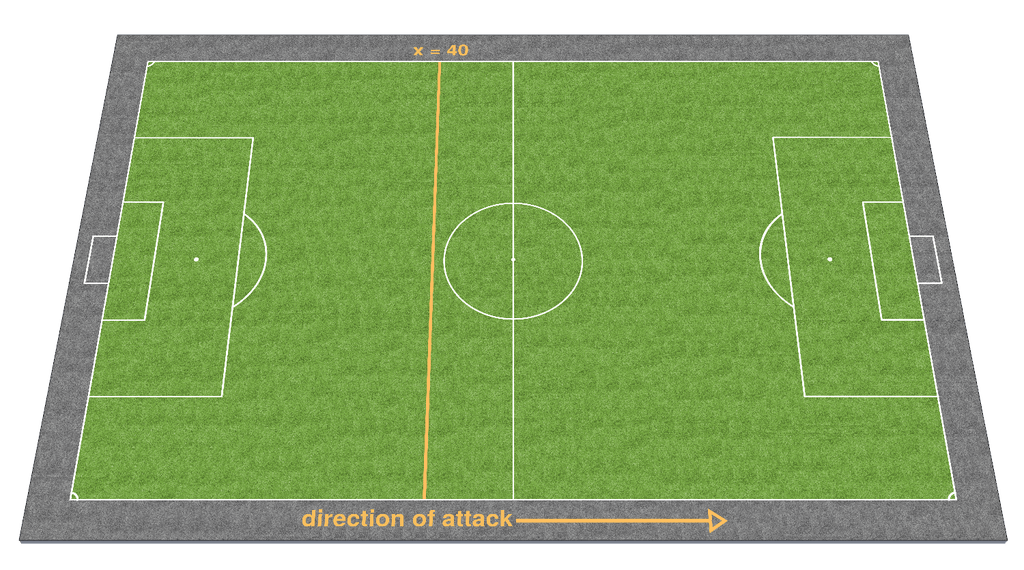
The rest of this article is for Subscribers only. If you would like quality content and debate free of trolls and knee-jerks, there’s a Subscribe tab at the bottom of the page.
[ttt-subscribe-article]