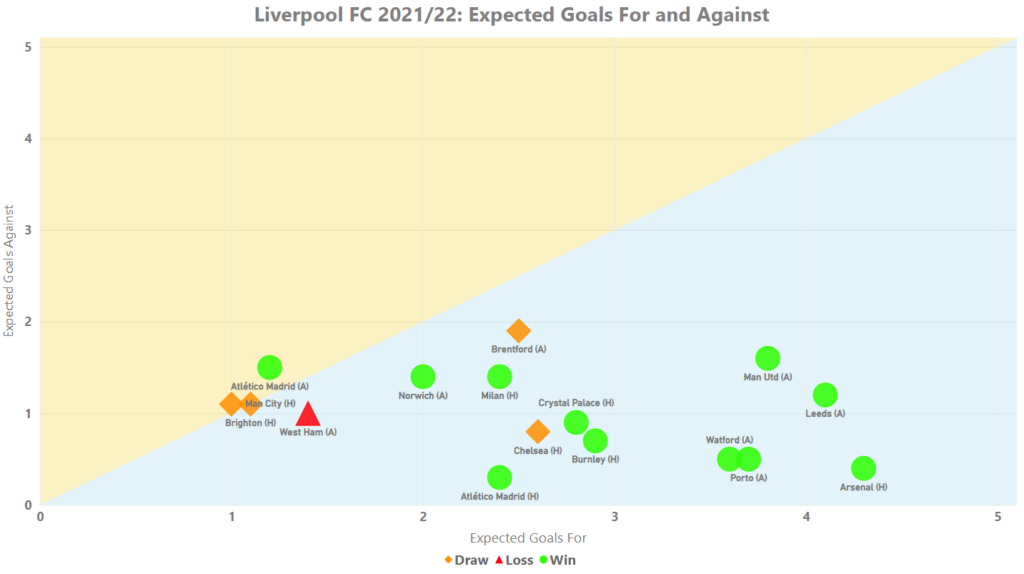
Won 12, drawn four, lost one. As starts to a season go, what Liverpool posted prior to the November international break in 2021/22 really wasn’t bad at all.
Yet it is an impressive record that remains tinged with regret. Wasting a 2-0 lead against Brighton prior to losing the club’s equal record unbeaten run meant the match with Arsenal could not come quickly enough (and it turned out fine). Add in that the Reds led twice against both Brentford and Manchester City but failed to win and were also unable to grind down the 10 men of Chelsea and there’s a warranted air of opportunities missed.
But it’s still very much all to play for in the Premier League and Liverpool have topped their Champions League group with two games to spare. Oh, how we dreamed of seasons starting in this way in the not too distant past. Let’s take a look at how Jürgen Klopp’s side have performed as they have reached this point, using our trusty data visualisations (and click on the images to open larger versions in a new tab, should you prefer).
Expected goals
We always begin with a look at the cornerstone of football analysis these days, expected goals. Win, lose or draw, Liverpool tend to dominate the statistics but how are they shaping up this season?
The rest of this analysis is for subscribers only – sign up for £5 month
[ttt-subscribe-article]
