While the 2020/21 season did not meet the pre-season expectations of Liverpool Football Club or their supporters, it’s safe to say that it was a hugely eventful campaign which won’t be forgotten in a hurry.
We can talk about a lack of penalties, the worst VAR record in the division and a failure to convert expected goals to actual ones (and we will), but it will forever be remembered as the season in which the Reds’ treatment room got shut down by the police for overcrowding.
That didn’t actually happen, but with 23 different members of the squad missing at some point, it easily could have. And can you even name 23 current Liverpool players? It’s not as easy as you think.
The tale of 2020/21 is predominantly a story about absenteeism, and the impact injuries have on the club’s performance has been clear for a number of years, as this chart will prove.
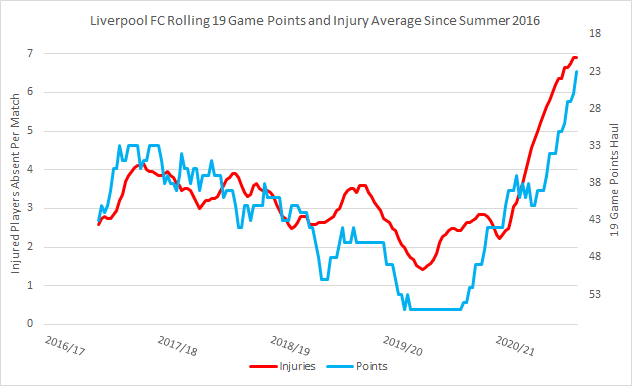
But there’s something very interesting about the above graph, and that is that it only covers the period up to Liverpool’s 1-0 defeat to Fulham in March. From that point onwards, the Reds drastically turned their form around and recovered sufficiently to finish third in the Premier League. The injuries must have dropped off for the final stretch of the season in that case.
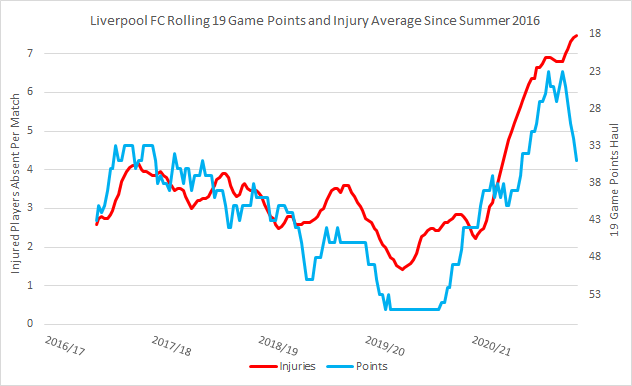
Apparently not. The injury count kept rising but the point total took a substantial turn towards the positive, and Liverpool will be delighted that it did. The season finished with the two lines on the chart the furthest apart they had been in the five year period covered, but was it just dumb luck or was something more deliberate at play?
Welcome to The Tomkins Times’ data vizualisation round-up for the 2020/21 season. And it’s live etc.
Expected goals
We’re going to focus on the league here, in order to keep the graphs a little less cluttered (and the Champions League matches ultimately proved academic). It has been a consistent theme in the past that Liverpool got the results they deserved to, for better or worse, based on the underlying statistics from their matches, yet at first glance this reliability was not as present this season.
This data (which is from Statsbomb via FBRef) implies that the Reds should have amassed 87 points, which would’ve been enough to finish top of the league for the second year running.
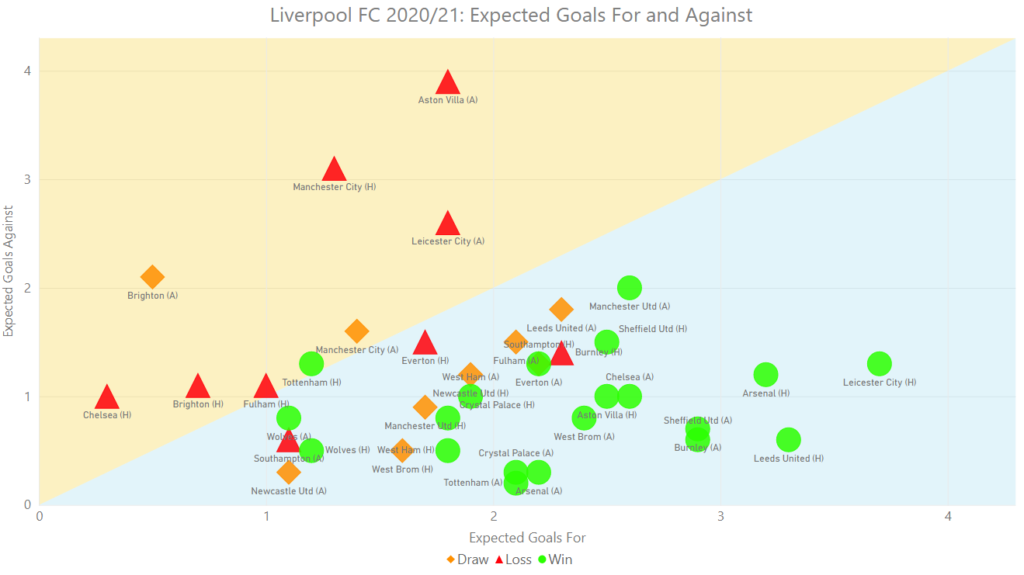
But before you start crying, remember that this xG data is mainly location based, and while it takes some account of the positioning of the defenders and goalkeeper, it says nothing for what happened after the shot was taken. So let’s take a look at the post-shot xG chart.
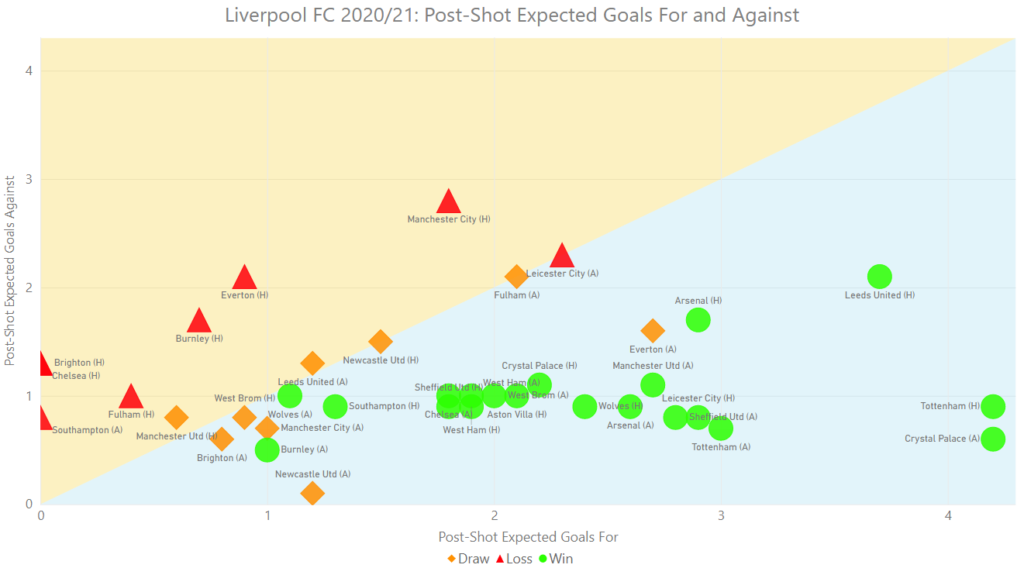
Straightaway the majority of the results are placed on the chart in line with where the underlying statistics suggest they should be (and don’t go looking for the horror show at Villa Park, as it’s somewhere off the top of the y axis). Lots of the draws that looked like they should’ve been wins in the first graph no longer do here. By this measure, the Reds’ efforts were worth 70 points, which aligns far more closely with reality.
And in many ways the difference between the above two charts ultimately defined Liverpool’s season. They were one of only four teams in the Premier League who had worse figures for post-shot xG than regular xG at both ends of the field. Of the three teams with a greater difference between their xGD and PSxGD, two were relegated and the other was Brighton, who have been breaking models all season.
However, the variance in the charts might explain Liverpool’s slump to a degree, but not their marked improvement over their final 10 league matches. Their xG difference in that spell was 11.2 but the post-shot figure was 7.4. The reason for their results must lie elsewhere, but we can come back to that issue in due course.
Expected goal involvement
This chart doesn’t usually offer too many surprises but it’s always worth looking at to see which players have contributed the most going forward for the mighty Reds. It’s also worth checking where the players sat in the previous round-up, to note any major shifts.
To be included here, a player had to amass a total of at least 2.0 non-penalty expected goal and assists.
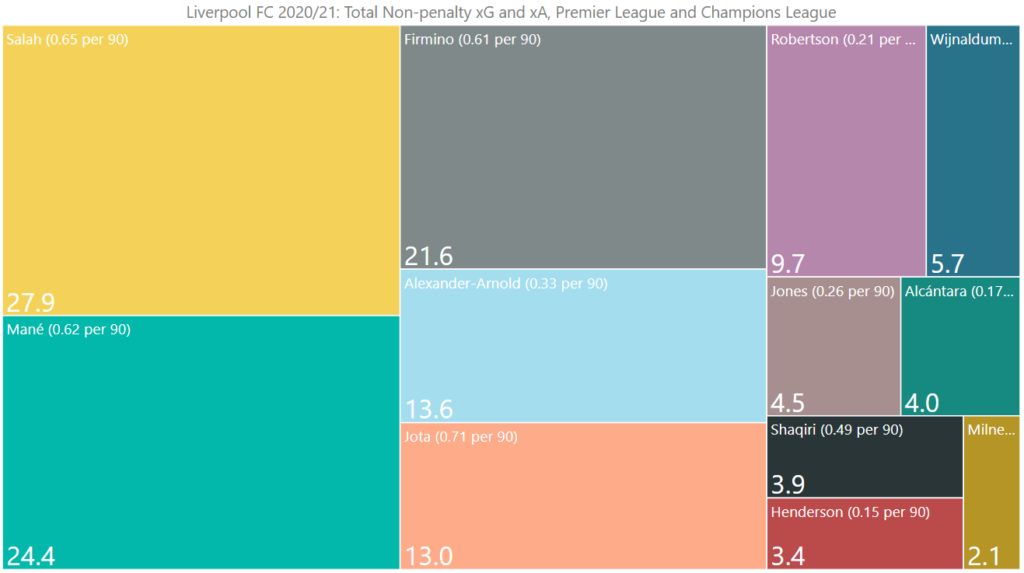
Trent Alexander-Arnold was sixth in these standings back in December, but elbowed his way into the top four by the conclusion of the campaign. It almost sounds like Liverpool’s season in a nutshell, doesn’t it? But will the Reds’ right-back have forced his way into Gareth Southgate’s squad for the European Championships? He really should.
https://twitter.com/BassTunedToRed/status/1397200155213025285?s=20
While the margins might be small, it was fascinating to see that the four main forwards all had per 90 figures in the range of 0.61 to 0.71, with Jota leading the way. Last season the front three ranged from 0.58 (Firmino) to 0.77 (Salah), and any deputies were at 0.52 or below.
Maybe it means nothing at all, but I can’t help thinking that it’s better for the health of the team if the four players competing for the three places in the front line all contribute broadly the same amount per match. They can be plugged into the line up in any combination and it shouldn’t make too much difference.
And a word for Curtis Jones, who had the best per 90 record of any player who wasn’t a forward or Trent. It will be interesting to see if he can continue to develop and become the driving xG&xA force from midfield which Naby Keita and Alex Oxlade-Chamberlain might be if they could hold their fitness issues at bay on a consistent basis.
Expected goals by combination
It’s always interesting to see which players have linked up to create chances in the Premier League and Europe, particularly when a certain Egyptian faces near-constant accusations of being a selfish player who has no interest in helping his teammates.
Anyway, to feature on the below chart a combination had to create at least six chances, or generate a minimum of one expected goal. Sadly that rules out everyone’s favourite duo of the season, Alexander-Arnold to Alisson, but it’s still worth a look. Any pairings of the four main forwards are highlighted in red, just so you know.
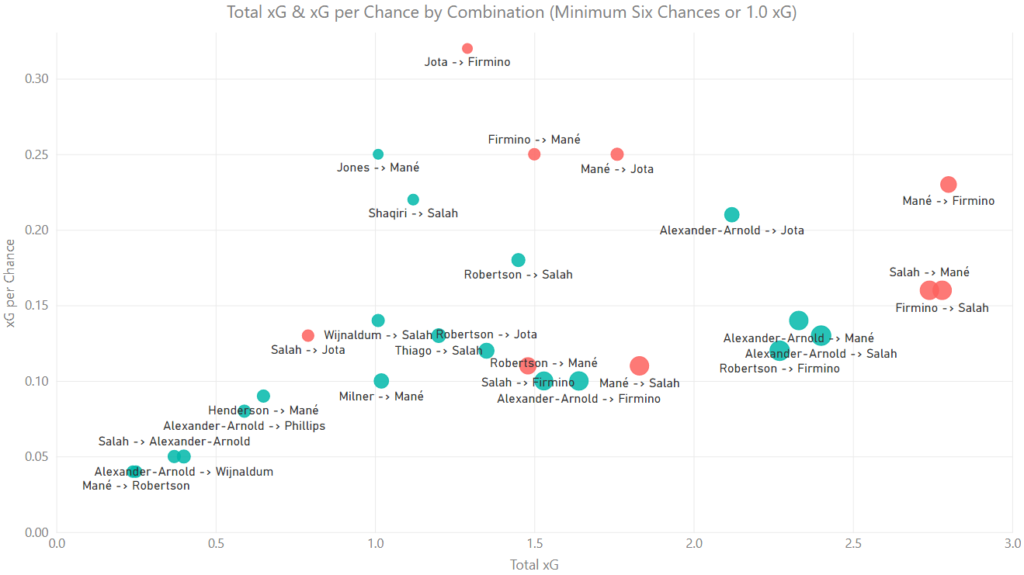
Perhaps it’s time to hand out a few awards. ‘Most chances created’ is a tie, between Alexander-Arnold to Salah and Robertson to Firmino, on 19. The former generated more expected goals but the latter won the assist count 3-0 so I guess that makes them the winner on a tiebreak.
Sadio Mané is not well known for his creative talents, yet he was responsible for the most productive duo on an xG basis (with Firmino) and the one which generated the most assists. His link up with Diogo Jota led to four goals from just seven chances created, so that is a pairing to watch next season, particularly if the Portuguese gets further opportunities in place of Firmino, which seems possible.
Oh, and who’s that on the chart near the top end for expected goals generated and with a healthy xG per chance rate? Salah to Mané. Imagine how good that duo would be if the former wasn’t selfish, eh?
VAR Stats
I don’t want to wade too deeply into the reeds of Premier League officiating, as Paul has done that superbly in his Black Swan Autopsy article. It’s worth putting the figures into a chart though, as they really emphasise what the Reds were up against in 2020/21.
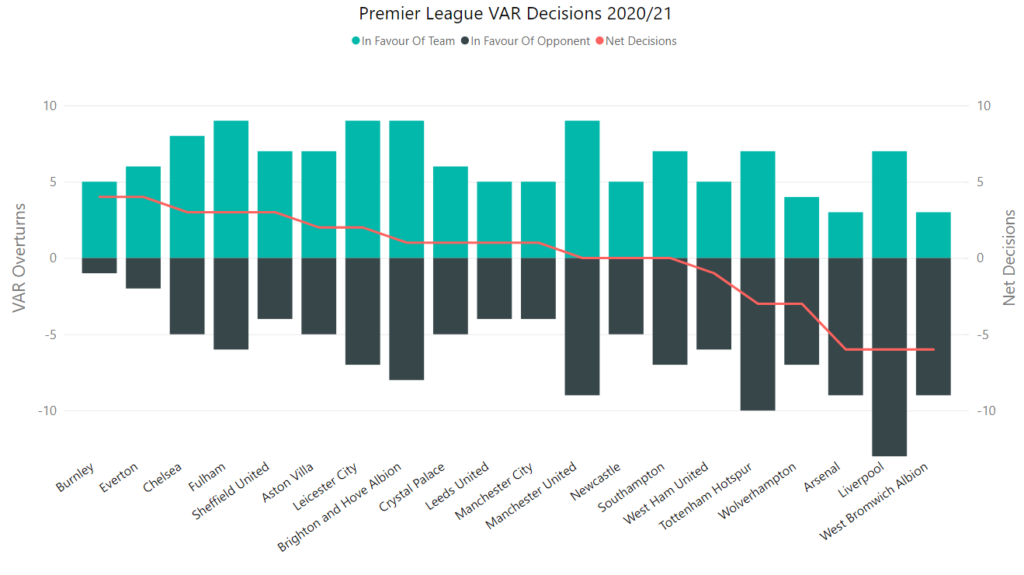
There were 13 VAR decisions which went against Liverpool this season. Bear in mind that 11 of the 16 other clubs who have been continually in the Premier League since the summer of 2019 haven’t had that many given in their opponents’ favour in the last two seasons, never mind in a 31 match period (as occurred between the Reds’ matches at Goodison Park and Old Trafford).
Only eight have had more benefit themselves than Liverpool had in that time, in fairness, but what makes it so galling for them is that so many of the ones which went for them in 2020/21 could easily have been dealt with on the pitch.
When your positive decisions include a penalty not being given against Fabinho at Fulham because the on-field referee thought it was not a foul and stuck with his initial call, it’s hard to feel too grateful for them.
Centre-backs (and injuries)
We have to conclude this round up with a look at the combinations of centre-backs that Liverpool have used this season, thanks to the injuries that their key players suffered.
The following video shows the total minutes played by each of the 20 (TWENTY) pairings as the campaign unfolded. See if you can spot the logic behind the seven groupings of duos, as denoted on the chart by the colour of their bars.
(It will probably help to view the video in full screen)
The combinations were grouped by their potential effectiveness; the pairings consisting of senior centre-backs, the combinations with one senior central defender and Fabinho, all the way down to the inexperienced guys who you’d have barely heard of before this season and wouldn’t have expected to see playing multiple matches at the climax of the campaign.
And while it won’t be apparent immediately, the final 30 seconds or so of the above video perhaps explain why the Reds finished the season as strongly as they did.
Beginning with the second leg with RB Leipzig, the partnership of Ozan Kabak and Nat Phillips started six matches together. The latter player then missed two – Fabinho stepped in – and when he returned he played the final five games with Rhys Williams. That level of relative calm at the back is chalk and cheese with what occurred in the first two thirds of the campaign.
While there were occasional late substitutions made, the defence was far more settled than in the early stages of 2020/21. And Liverpool’s defensive record proves that this matters. When any pairing played a full match the Reds conceded a goal every 108 minutes, which is a pretty impressive return.
But for 17 of the 53 matches in all competitions, Klopp used two central defensive combinations within the 90 minutes. The starting pairs let in a goal every 65 minutes, with the second set being breached every 56 minutes.
In the first 12 instances of two centre-back pairings being used in a match, the second duo spent an average of 42 minutes on the pitch; for the final five, which began at the Emirates Stadium in April, they only got 52 minutes in total.
How much influence the stability at the end of the campaign had is up for debate, but the results were certainly much improved, and it can’t be a complete coincidence. A season which had begun with Joe Gomez and Virgil van Dijk was ultimately rescued by these two heroes.
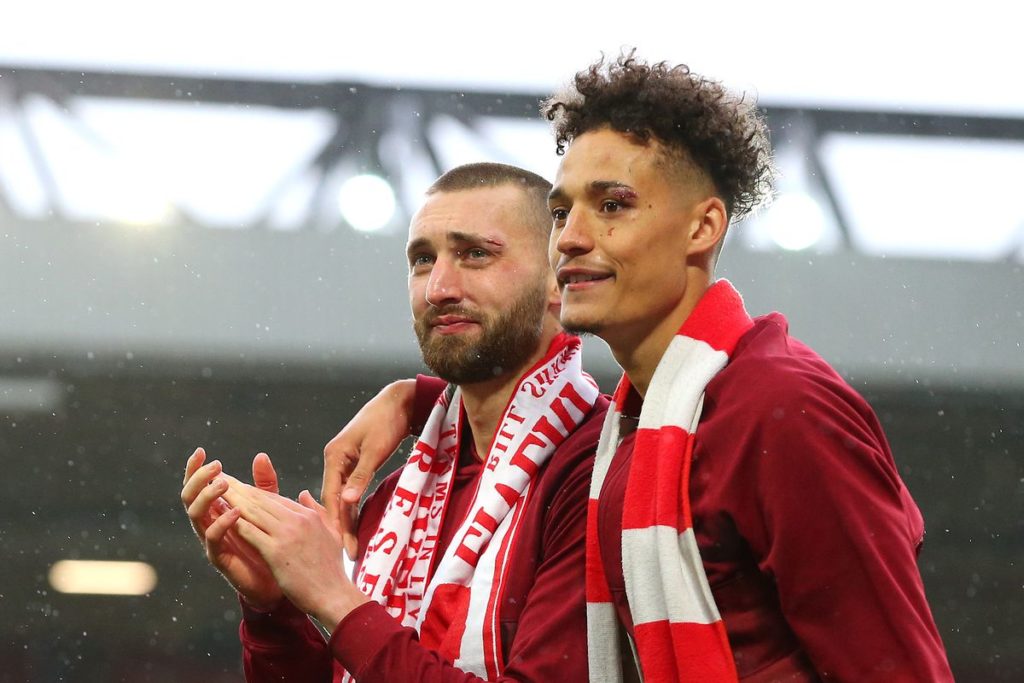
Walk around them on your way into the 2021/22 Champions League, Reds. They deserve it.