
The expansion, development and wider acceptance of expected goals (‘xG’) continues to grow apace. As much as it’s great to be able to quantify the value of shots, not every brilliant attack results in an attempt at goal. I wrote recently on how Stratagem collect ‘dangerous moments’ in their shot data, but FiveThirtyEight have gone further by posting non-shot expected goal figures for every match across multiple leagues.
This isn’t a new concept in itself; there have been OptaPro forum presentations on the subject of non-shot xG, and TTT subscriber Will Gürpınar-Morgan has written about it before (here). To my knowledge, FiveThirtyEight are the first to share match-by-match data though, so I thought it was worth having a look into it. Here’s their explanation as to how their non-shot xG is calculated.
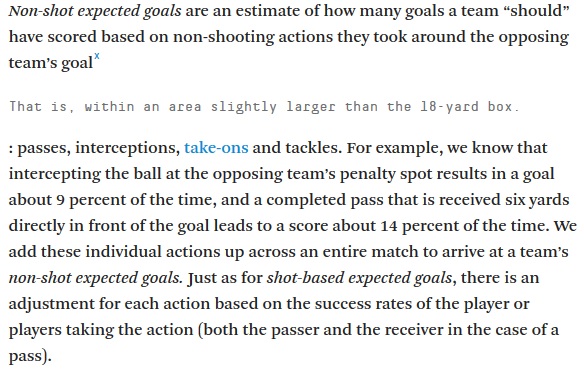
It’s clearly not definitive. The model only takes accounts of four types of action, and then only when they are in-and-around the penalty area. A team like Liverpool, who strive to win the ball in the final third, wouldn’t be rewarded for doing so in this model too often. But it may still provide points of interest; consider this article a starting point for debate, rather than the absolute gospel truth on this matter.
I collated both the shot and non-shot data for the 2016/17 season, and the first thing I noticed was there were 1136.7 non-shot expected goals, but only 1028.9 shot xG. As there were 1,029 goals last season (excluding own goals), the shot model appears the more closely matched to reality.
The two models matched exactly in a game around 5% of the time; there were 20 examples for home teams, and 20 for the aways. In terms of differences of one-or-more in either direction, that happened 15.8% of the time. So why would a shot and non-shot model not match? I’ve tried to think of a few reasons, and I’m sure this won’t be exhaustive.
- Defensive errors. An innocuous build up can be given a high shot value by mistakes at the back.
- The officials. Awarding a penalty will bump up the shot xG figures when there often won’t be a build up of that level. There were a handful of matches where a team had a penalty and a higher non-shot xG figure, but it’s understandably quite rare.
- Important shot build up taking part outside FiveThirtyEight’s non-shot area. Consider Mohamed Salah’s goal against Arsenal. He didn’t win the ball in the Gunners’ half, never mind their penalty area. A few seconds later, he had a clear-cut chance.
- Lucky rebounds. If the ball is parried by the keeper, deflects off a player or comes off the post (think about Mané at Goodison, if only to put a smile on your face) then it won’t be in the non-shot xG but might lead to a chance of huge value.
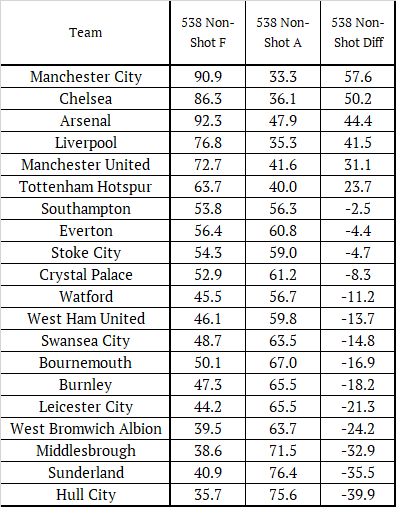
In short, as with everything in football, the spectre of luck and chance will play a part. Perhaps the differences between the models won’t tell us much at all, but from an analytical perspective it’s always nice to have a new form of data to play with. For the record, here is the non-shot xG table for 2016/17:
The rest of this analysis is for Subscribers only.
[ttt-subscribe-article]