
By Andrew Beasley. Data is from Opta and correct as at 02/05/2017.
Go on then, guess how many articles we’ve published on TTT before today’s! It’s fitting that our 3000th article is by Beez, as it was our stats ninja who noticed 2999 articles had appeared since the first, back on 12th November 2008, Rotation Myth Will Never Die! by Paul Tomkins.
Here’s to the next 3,ooo! Now, on with this one …
I wrote a Tomkins Times article last month (comparing Liverpool against the teams in La Liga and the Bundesliga), and a comment from the man with his name above the door of this establishment prompted me to do some data digging.
As well as looking at the defence, I thought it was worth taking a look at the front end of the team too, so I’ve got numbers on that. As for at the back, if you think Liverpool are bad at defending set pieces, wait until you see what situation they really struggle with.
But that can wait. First I need to clarify what Opta’s definition of a clear-cut chance is, in case you’re not aware. It is a “situation where a player should reasonably be expected to score usually in a one-on-one scenario or from very close range”. It’s often a little contentious as it’s a subjective statistic, but I’ve found that from tracking them for a while you get a pretty good idea of what will or won’t be classified as a clear-cut (a.k.a. “big”) chance.
To begin, a look at what percentage of Liverpool’s clear-cut chances (or ‘CCCs’ for short) each player has been involved with, and how often they are involved on a pro-rata basis. The only column which may not be clear in the below table is ‘Other Involvement’; this is where a CCC has not been directly created by one player passing to another. I have therefore watched match footage to establish who was the last player involved prior to the shot.
It might be that a shot is saved or off target and goes to another Red (think Sturridge to Mané via the post at Goodison), or perhaps a pass or cross deflects off an opposition player on it’s way to the eventual shooter (such as when Moreno’s corner at Sunderland found it’s way to Mané via a defender). Here are the figures.
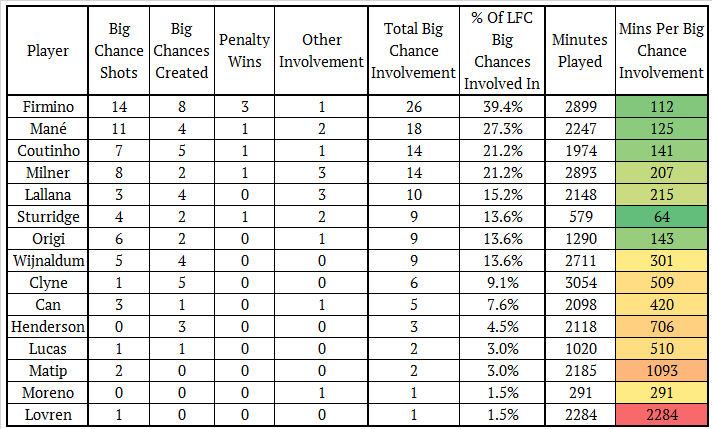
There are no surprises in the top five, as it’s the club’s premier attacking quartet plus the penalty taker (and spot kicks are included in CCCs, in case you didn’t realise). Daniel Sturridge may have had a disappointing campaign, but it’s clear from these figures how involved he has been in Liverpool’s top quality attacking play when he has actually taken to the pitch.
The former Chelsea man has had four clear-cut chances this season, and despite putting all of them on target three of them have been saved. Anything is possible with a sample as small as that of course, but considering he scored 45 goals against an expected goals tally of 34.4 across his first four seasons at the club, it’s not unreasonable to think he might have scored all four of his big chances this season.
Looking at how the chances were created throws up some interesting information.
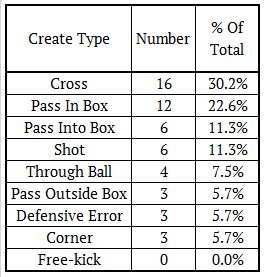
Crossing has a bad reputation, both generally and also when considering Liverpool’s ability at performing the action, yet in open play alone it accounts for 30% of the Reds’ directly created clear-cut chances, and adding in corners takes the total contribution to just past one in three.
A cross can come in many forms though, and it’s of course important to remember that Liverpool have attempted over 700 crosses this season that haven’t led to top quality goal scoring opportunities, so it’s not like that they should definitely pursue this as a strategy. But it is clear that when they get it right, Jürgen’s boys can make the most of deliveries from wide areas.
Looking at the same figures for the opposition reveals the issue that I hinted at in the introduction. Liverpool allow more from set pieces than they create, but it’s another type of pass that they have been highly susceptible to.
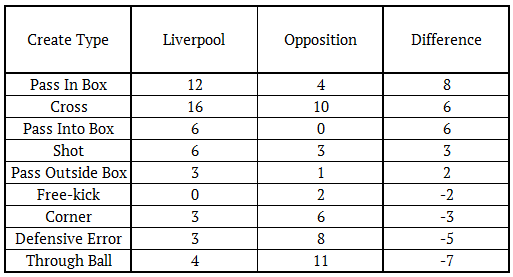
It won’t surprise anyone to see that Liverpool’s opponents have been more handy than the Reds on free-kicks and corners, and the defensive error numbers are both predictable and depressing in equal measures.
But it’s with through balls that Jürgen Klopp’s team have really suffered this season. Or perhaps teams have been highly efficient with them; according to WhoScored, Liverpool’s opponents have only collectively averaged one through ball per game against the Reds, so a clear-cut chance every three games or so seems high to me.
To concede such chances to the brilliance of David Silva or Alexis Sanchez seems fair enough, but the likes of Swansea, Watford, Hull, and Burnley (all of whom have created fewer than ten through-ball chances in total this season) have sliced through the Liverpool backline with ease in 2016/17. This will definitely in part explain why Liverpool allow the highest proportion of clear-cut chances in their own box this season, as a successful through ball leads to a guaranteed one-on-one with the goalkeeper.
The through ball figures aren’t surprising in themselves, as teams usually defend deep against the Reds to try to guard against such passes, and Liverpool themselves tend to play a fairly high line which leaves plenty of space in behind, but the ease with which opponents create big chances this way needs to be remedied.
The other concerning aspect of clear-cut chances is how poor Liverpool have been in the second half of this season. I plotted the below graph, which shows how the Reds’ total clear-cut chance difference per game has changed as the campaign has progressed, and it’s an ugly trend.
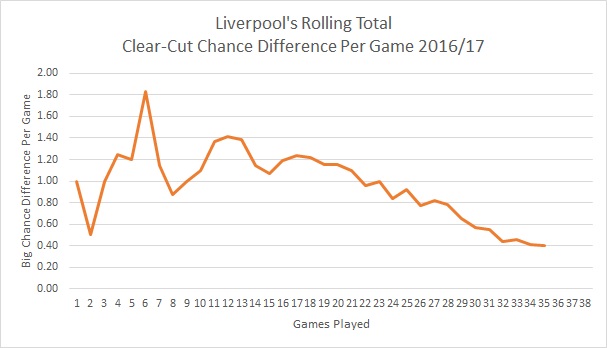
At the half way point of this season, Liverpool had amassed 41 clear-cut chances and allowed only 19. A difference of 1.16 per game has only been bettered twelve times in the past five complete Premier League seasons, so across the first 19 matches of 2016/17 the Reds had been at an elite level on this front.
But ‘down the back nine’ they have had 25 whilst allowing 33, meaning that at the time of writing their CCC difference per game for the season is 0.40, which is worse than four of the last five campaigns (with 2014/15 the exception). Manchester United have allowed 26 clear-cut chances this season; Liverpool have allowed 26 in their last twelve matches.
So if we are to blame a centre-back pairing for this, as per Paul’s question at the top of the article, who should it be?
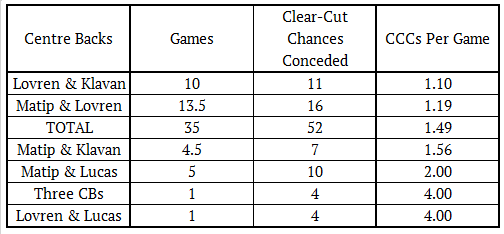
In reality there are myriad factors to consider when looking at why a team concedes high quality chances, but there’s certainly a surprising pair at the top of this list. They’ve faced City, United, Arsenal and Everton in their ten games too, so Lovren and Klavan haven’t had an easy ride of things.
With an eye on the future, Virgil van Dijk has been strongly linked with a move to Anfield in the summer, and Southampton have only allowed 0.86 CCCs per game when he has played this season. Whether it’s van Dijk who joins or not, Jürgen Klopp needs to find a way to halt the through ball and set piece issues in Liverpool’s defence if they are to have a better crack at winning the title next season.