By TTT Subscriber Graeme Riley.
Setting the scene
(All figures quoted are in 2015-2016 TPI values)
For those not familiar with the concept of TPI, since 2010 I have been capturing data on all players in the Premier League including their transfer values paid. By comparing the average transfer from one season to the next it is possible to establish the rate of inflation and this can then be applied historically to all previous transfers to give an updated value for any player or team. Whilst not an attempt to estimate the current market value of a player, it has proven to be a robust model to be able to compare the performance of squads.
Another record for spending in the Premier League saw the average transfer fee reach almost £7.8m, an increase of 21.5% over the previous campaign. Furthermore net spend increased to an unprecedented level with the 20 clubs spending £646.5m to other leagues (either overseas or within the Football League) as compared to £491.1m the previous year. Biggest net spenders were Man City, with £121.4 being spent more than taken in sales, but it is perhaps surprising that the second biggest net spend was Newcastle, with £72.3m, but this was not enough to save them from relegation. Leicester outspent 12 other teams, including Liverpool (£33.6m), Everton, Arsenal, Spurs and West Ham, but this was seen at the time as more of an attempt to stave off relegation rather than demonstrating loftier ambitions.
An unpredictable season
Before this season nobody had finished more than fifteen places higher than their TPI ranking would have predicted, with both Norwich and QPR achieving this in the inaugural season. Since then only two teams have managed to outperform their TPI ranking by 14 places, QPR almost repeating their feat the following season whilst Bolton were sixth in 2004-05 when they should have expected to finish 20th in the table. This goes some way to putting Leicester’s achievement into context as their squad cost should have led them to believe they could finish 18th in the table and thus they would be facing Championship football next season, instead of which they finished 17 places higher.
Only one other team finished as many as eight places or more away from their expected position, this questionable honour falling to Newcastle who were nine places lower than their squad should have placed them, as they should have been comfortably in the middle of the table. (Liverpool should have been fifth, by the way).
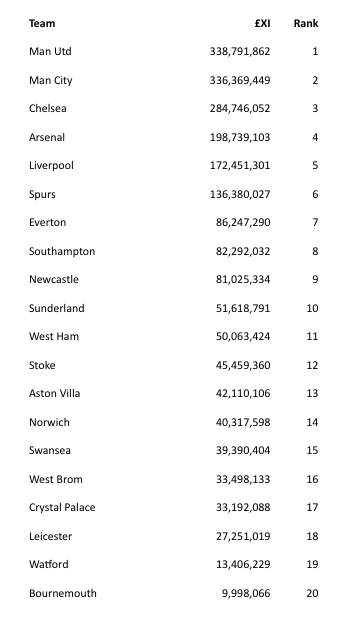
It should have been neck and neck between the Manchester clubs, with City having a £XI of £336.4m, just below United’s £338.8m, but of course rather than battling it out for the final Champions League place, the focus of both teams should have been the title itself as they were far and away the most expensive teams in the division. For the first time since 2002-03 Chelsea did not lead the table of the most expensive starting eleven, dropping to third place with a £XI of £298.9m, their lowest absolute value since 2003-04 in Abramovich’s first season as owner. This is down from a peak value of £482.9m in 2006-07 and even as recently as 2010-11 they could boast a £XI of £419.5m, so this truly represents their most frugal season for some time.
With Watford and Bournemouth also doing much better than their squad could have expected, this left an extremely crowded midfield, and it was thus Villa, Norwich and Newcastle who suffered.
Not only was Leicester’s finishing position a surprise, but the results during the season were also very unpredictable. Since the Premier League was reduced to 20 teams in 1994-95, the lowest level of predictability at individual match level using £XI as a yardstick was 40.3% in 1998-99 (the highest was 48.9% in 2009-10) but this season it dropped below 40% for the first time, reaching just 39.2%, barely more than randomly selecting from the three possible outcomes for any match. Most unpredictable of all were Stoke, for whom only three of their nineteen games at home ended as predicted by the value of the respective teams’ starting elevens. At the other end of the scale, Old Trafford proved to be a fortress for Man Utd where almost three-quarters of games were won by the home side and although other teams matched their home points total, they did so by picking up points where not expected. Perhaps van Gaal’s failing was their away record where only 37% of games went with £XI, and ultimately this is what cost him his job.
In the final table, not one club finished in the exact position where they would have been expected based on their £XI, and as a result the average place away from where they should have been was 4.8 places and even without Leicester it would have been 4.2 places, higher than any season since the millennium other than 2003-04.
So the question arises, how did Leicester succeed where richer, better placed teams failed? Yes, they did spend more than the majority of other teams in the division, and apparently wisely, but probably most important of all, they settled on a team early on, and kept their players fit. Four teams, one of them Leicester, had two ever-present players during the campaign, but more tellingly, eight players appeared in more than 80% of their games, with only three other teams (Spurs, Swansea and Watford) having as many as six. Although this is no guarantee of success, with Burnley having had three ever-present and eight players at over 80% in their relegation season the previous year, this does provide a solid foundation. (Liverpool had no ever-present players and only two over 80%, although the chopping and changing during the final weeks of the season did not help, as the Reds had 30 players in the starting XI during the season, more than any other club).
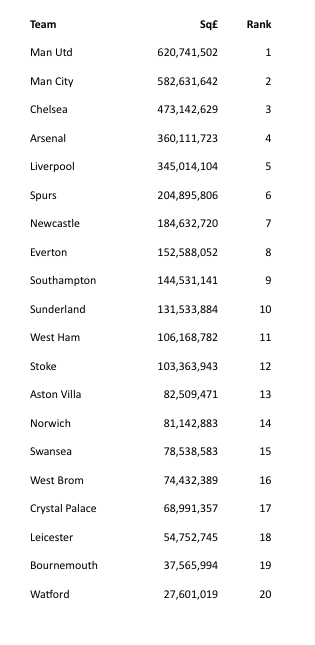
As the above table shows, the value of the squads are largely in line with the £XI put onto the field.
Interestingly, the value of players by age has become skewed towards those in the age bracket 16-20, for whom the average transfer fee was £8.3m compared to £8.2m for 21-25, after which the value trails off rather alarmingly. The average spent on UK born players was £6.3m, up from £3.8m last season and easily the highest since the inception of the Premier League. Players from the EU cost an average of £8.7m, also up on last year’s figure of £8.0m, whereas the value from the rest of Europe was down to £5.8m from £9.2m as clubs are not looking so far afield for their players. The average from the rest of the world also dropped from £7.7 last year to £7.2 this season.
Prior to this season only 12 games had seen a difference in £XI between the sides produce a positive result for the team with the lower value, but during 2015-16 there were a further six occurrences – Man City v West Ham, Chelsea v Bournemouth, Man Utd v Norwich, Stoke v Man Utd, Man City v Leicester and Sunderland v Man Utd.
Effectiveness in front of goal
 Leicester were neither the most prolific in front of goal, nor did they have the best defence, however they were certainly amongst the frontrunners on both counts and it was this combination that secured them the title. Their total of 523 shots was bettered by eight teams, with even Chelsea having more chance that the Foxes, but it was their ability to turn shots into goals that saw them come out on top with 13.0% of all shots producing goals, as only Everton managed as many as 12.0% (Liverpool were 9.8%, the lowest in the top half by some distance). At the other end there was a similar story, with only 7.0% of shots against them producing goals, with nobody else within 1% point (Liverpool, at 12.6%, were the worst in the top half).
It was a similar story with shots on target producing goals, Leicester converting 39.7%, higher than anyone else, but Arsenal did manage to prevent the opposition at a better rate with only 23.7% of opponents shots on target resulting in goals, compared to Leicester in second place with 25.2%, these two being well clear of the field. (Liverpool’s figures were a disappointing 31.0% for but a staggering 37.6% against. The only teams with a worse record for conceding since 2000 were Everton and Newcastle last season and Bournemouth, Norwich and Aston Villa this season, the Cherries conceding a the rate of 43.5% of shots on target, almost every second attempt).
Only two teams enjoyed less possession than the Foxes at 44.4%, these being West Brom at 42.7% and Sunderland at 42.8%, with Man Utd’s 60.5% topping the list (Liverpool had 59.9%). It can therefore be seen that possession is not everything, especially this season, for it was easily the lowest for a title-winning team since 2004, the previous lowest being Chelsea’s 51.8% in 2005-06.
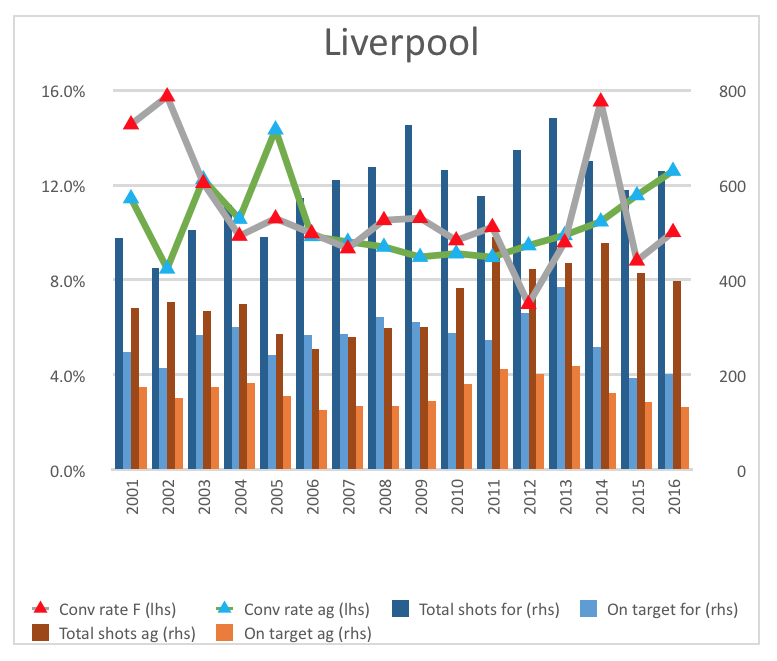
Worryingly for Liverpool, as the above graph shows, there has been a long term trend for opponents to convert their chances covering the last six or seven seasons, whereas apart from the spike of the 2013-14 title challenge, there has been a levelling off of chances taken. The Reds need to improve at both ends of the field if they are to become realistic title challengers.
Does goal difference make a difference?
What is better, to score more or concede fewer? Based on TTT subscriber MCheyne’s concept of using goal difference as a proxy for expected performance, it is possible to re-assess how efficient (or alternatively lucky) a team has been.
If we break down the league table into home and away, it is possible to analyse the results since 1888 which give each goal difference. (To make the playing field level, I have assumed that there were always three points for a win and goal difference has always been in place, not goal average). So for example, 78 teams have finished the season with a home goal difference of exactly 10 goals, playing 1,596 games in the process. These games finished with a distribution of 19 losses by more than three goals, 45 losses with three goals, 108 losses with two goals, 227 losses by a single goal, 423 draws, 359 wins by a single goal, 229 wins by two goals, 120 wins by three goals and finally 66 wins by more than three goals. At the extreme ends, there is little point in analysing the data beyond three goal margins as we are really only interested in the outcome anyway, not the margin of victory. Having done this for all permutations of goal differences (I’ve also topped and tailed at -40 goals and +40 goals as the extremes are likely to be so small in volume that they could be misleading), we can now see the percentage of results which make up a typical goal difference for both home and away finishes. We would therefore expect a team with a +10 home goal difference to win 48.5% of its games, draw 26.5% and lose the remaining 25.0%. A team playing 19 games at home can therefore expect to pick up 33 points on average. Armed with this split and reproducing the analysis for away games, it is now possible to apply these expected outcomes to the real tables, both past and present.
This is how the table would have looked if the goal differences had produced the expected level of points:
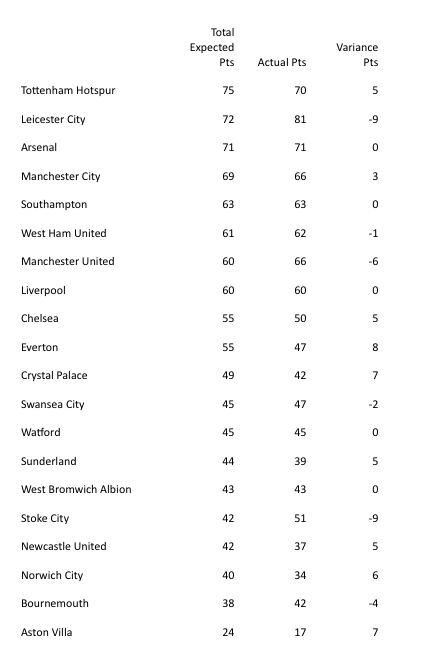
Spurs would therefore have been champions, with Leicester second and Arsenal third. This demonstrates further just how clinical Leicester were, not only in taking their chances but in converting their goals into points. The only team in the same ballpark were Stoke, who could have been expected to fight against relegation given their goal difference, but instead they were comfortable in the middle of the table.

To get a real feel for what this means, we can look at previous champions and see whether nine points is the usual gain from goal difference distribution. As you might expect, the team that finishes top of the table does benefit more than most from their goal difference, with the average expected gain being 3.7 points per season, whilst at the bottom, the team in 20th can expect to lose 2.4 points. Even accounting for this average gain across all seasons, Leicester were indeed fortunate in the number of points they gained, being some five more than the long term average would have predicted. Only 13 champions have ever had a return of more than nine points greater than they might have expected based on their goal difference, the luckiest of all being Everton in 1970 when they took 18 points more than they could reasonably have expected. Indeed this level of fortune is greater than any other side in any other finishing position, with only 65 in total (out of almost 2,400) gaining more than points.
The perfect storm?
Clearly from all of the above, Leicester made the most of their opportunity. A financially inexpensive squad, converting chances at a better rate than anyone else whilst keeping them out at the other end at an almost unprecedented rate and then using their results to garner more points than they could reasonably have expected to do so. But there is one final point – the number of matches played.
A Fox, earlier today …
Since 1991 when English clubs were re-admitted to Europe after the Heysel ban, the title-winning team has played an average of 56 games in all competitions (excluding Community Shield, Super Cup and World Club Championships), with the highest being 63 by Man Utd and the lowest in 1992, when Leeds played 48. Generally the top teams will have been in Europe and so there is little advantage gained either way, but in contrast to 2013-14 when Liverpool played 14 fewer than Man City in finishing second, Leicester, as title winners played 10 fewer than the team immediately below them, Arsenal. This is the biggest advantage enjoyed by a title-winning team since Aston Villa in 1981 as they played 20 fewer games than Ipswich, as Bobby Robson’s team embarked on a UEFA Cup run which took them to the final, completing a remarkable 66 games in the process. With Leicester playing just 43 matches, the last team to win the title with fewer matches in a season was Blackburn in 1914, over a century earlier. The Foxes didn’t just have the wind in their sales, they had a full blown gale with their rigging flapping around them while everyone else was clinging to their lifeboats.