By Daniel Rhodes.
(Brendan Rodgers enters the room…)
John Henry: “Sit down Brendan, we need to talk.”
Taking inspiration from Moneyball 2 (How Pascal’s Triangle Led to a Mental Season), an emergency meeting was called in Boston. After 19 matches this season, at the end of 2014, Liverpool manager Brendan Rodgers was flown over to Boston to discuss the team’s performances during his tenure. Rodgers had a dossier. Henry had another. TTT managed to get some quotes (and graphs) from the meeting.
(We didn’t really, all quotes are made up, before you get any ideas Metro.”
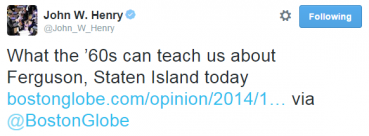
Henry: “This was my tweet at the end of December…”
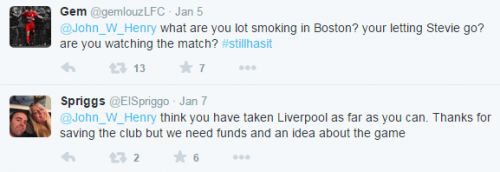
Henry: “… about a very sensible article, referring to ‘the civil rights movement of the 1960s, when racial issues were at the forefront of our consciousness and when our country was moving in a progressive direction.’ I did not expect this reply within seconds of the tweet:
Henry: “Nor do I appreciate my jokes being thrown back in my face, or being told I have “no idea” about football:
Rodgers: “You need to stay off Twitter, I did a search after my first game away at WBA, haven’t been back since.”
Henry: “That’s not the point though is it, last season, you were the messiah. A genius manager over-achieving beyond all expectations, and nearly securing the coveted title all Liverpool fans crave. This season, quite a few want you fired. How do you explain such a turnaround?”
Rodgers: “Well, I’ll ignore that Uruguayan elephant in the Barcelona kit sat in the corner of the room – although it is a bit disconcerting – and start with some underlying attacking stats.”
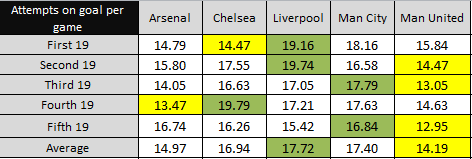
Attempts on goal:
(Green is ‘best’ or highest, yellow ‘worst’ or lowest.)
Rodgers: “Most attempts on goal in the Premier League since I arrived at the club. Hard to argue with that…”
Henry: “Well let me try, it isn’t only the number of shots is it, surely you need to break it down more than that? I read this article by Dan Kennett on StatsBomb, and he said:
The total shots inside the box has remained almost constant over five seasons with an average conversion of 13.1%. Season conversion rates vary from a low of 12.4% (1 in 8) to a high of 13.5% (1 in 7.4)
Where it gets interesting is shots OUTSIDE the box. The total shots taken outside has declined year on year for five seasons. The total has fallen by 12% from 4600 in 2008/09 to 4050 in 2012/13
The conversion of shots outside the box has also improved over time (even if 2012/13 was slightly less than 2011/12). In 2008/09 the figure was 1 in 50 open play shots outside the box scored a goal! Over the last two seasons this has improved to 1 in 30. Over 5 seasons the average is 1 in 37, a huge difference to the 1 in 15 scored from direct free kicks.
Henry: “So if the vast majority of our shots were outside the box, then the chances of them ending up as a goal are significantly reduced, surely?”
Rodgers: “Depends how the elephant in the corner felt on the day, did you see some of his goals?
The rest of this post is for subscribers only.
[ttt-subscribe-article]


