
In the days following the Swansea disappointment I heard two main complaints from the majority of the fanbase:
1) Results aren’t good enough to get us into the Champions League
2) Performances aren’t good enough to get us into the Champions League
In two posts this week before the domestic season resumes I intend to build on Paul’s recent post of the same name and examine both statements. The goal is to try and understand if that’s fair comment or whether in fact there is cause for optimism.
Part One: “Results aren’t good enough to get us into the Champions League”
As it stands Liverpool aren’t going to qualify the Champions League. The season so far has been a very mixed bag, not least because the away games have been mostly “difficult” and the home games mostly “winnable”. So how are we actually doing and can we realistically qualify for the Champions League?
The benchmark I will use to place our season in context is not the whole history of the Premier League, just the years since 2001/02 when England has had four Champions League places. Since then, the average points total for a team finishing 4th is 68. Coincidentally Liverpool hold the records for the best (76 in 2007/08) and worst (60 in 2003/04) 4th place finishes in this period. The record for the most number of points and NOT qualifying for the CL is held by Man City, 67 in 2009/10.
Based on the two facts above, at the start of the season, it would therefore be realistic to track progress against a 68 point target. This means 1.79 Points Per Game (PPG)
After over a quarter of the season, Liverpool are very slightly below target on 1.73 PPG (66 points). As a point of comparison here, Dalglish averaged a very similar 1.83 PPG (70 points) over 18 league games last season.
So the question now has to be, if Liverpool are broadly on target for a traditional fourth placed finish then why are we out of the CL places? Most importantly, is the bar being raised in some way and is some re-planning required?
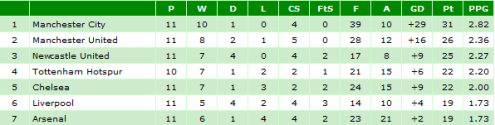
The short answer is yes. The table below shows the Premier League record for each of the top seven positions:
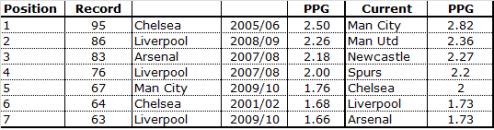
So after a quarter of this season, each of the top seven teams is on course for a record Premier League score for that position in the table.
These extra points aren’t being plucked out of thin air and there’s only a finite number to accrue, so where are they all coming from? (Before I continue there’s one major caveat, in that we will be able to draw much firmer conclusions once everyone has played everybody else by the end of December).
The first assumption is that there must be significantly fewer draws so far this season. Well, no actually. So far this season, 24% of matches have been drawn compared to an average of 26% since 2001/02. This season’s performance is within one standard deviation of the mean so nothing unusual there.
Trying to keep this as brief as possible, Standard Deviation (SD) is used to measure the variability in a data set and how much variance there is from the average. 68% of data in the set will be within one SD of the average and 95% within two SD.
This means only one in 20 occurences will be over two SD from the average. So far, this season looks like it could be that season. This season is “the outlier”.
Here’s why (and no, it’s not just because Man City have got 31 points from 33)
The rest of this post is for subscribers only
[ttt-subscribe-article]
)