By Dan Kennett, with expert review and contributions from site members Graeme Riley, Zach Slaton, Taf McDonald, Daniel Geey and Paul Tomkins.
UEFA Financial Fair Play. A phrase that has been used in recent times by even the most lay of football fans. But what is it? And does it matter for LFC? This article attempts to keep things extremely simple but at the same time demystify UFFP and explain how it impacts Liverpool Football Club.
Our principal owner, John W Henry, has given 2 interviews to The Guardian where he has talked definitively about FSG’s approach to ownership and UFFP. First of all in November 2010:
Henry said UEFA’s impending financial fair play rules, which will be introduced in 2012-13 and eventually require clubs to break even on football operations, had been a key factor in persuading NESV [now FSG] to buy the club. He said they would leave Liverpool much better-placed to compete with such clubs as Manchester City and Chelsea: “They are operating under the current rules. The rules are going to change.”
Then in an extended interview in February 2011:
“The big question is just how effective the financial fair-play rules are going to be. Perhaps some clubs support the concept in order to limit the spending of other clubs, while implementing activities specifically designed to evade the rules they publicly support. We can only hope that UEFA has the ability and determination to enforce what they have proposed.”
“We’ve always spent money we’ve generated rather than deficit-spending and that will be the case in Liverpool…it’s up to us to generate enough revenue to be successful over the long term. We have not and will not deviate from that.”
“We intend to get younger, deeper and play positive football…our goal in Liverpool is to create the kind of stability that the Red Sox enjoy. We are committed to building for the long term.”
So there we have it straight from the horse’s mouth. Not only do FSG embrace UFFP but they’re already planning to exploit it. However John Henry is right to raise the one big unknown about UFFP: how strictly will the rules be enforced? In a nutshell, if a club wants to compete in UEFA competitions it needs to be granted a UEFA licence. The UEFA licensing system is already in operation. In recent times the highest profile club to have been denied a licence is Real Mallorca who were unable to take their place in the Europa League (UEFA say a total of 27 clubs have been refused a licence over the years). For 2011-12, 3 clubs have been refused a licence, including FC Timisoara for next season Champions League. UFFP is simply a complicated extension to the UEFA licensing system. So in theory a team in breach could be denied entry to the Champions League group stage and the £25m minimum that comes with it.
There are a lot of cynics and sceptics who think that UFFP will come to nothing and when push comes to shove UEFA will not stand up to the big boys. There’s also been a lot of ignorant discussion about loopholes in the regulations and scenarios that will never be allowed like the £100m half time pie for Sheikh Mansour or the £250m Chelsea sponsorship deal with Sibneft. However a lot of the concern is valid but is not in scope for this article because it’s too early to tell how possible any workarounds for clubs are. Instead my starting assumption is: can any owner or chief executive of a major club accept the risk of UEFA strictly implementing the UFFP regulations? i.e. will any club be brazen enough to spend with impunity and carry on regardless? Or will in fact all clubs come in line to some degree?
Why are UEFA doing this?
Despite the game being more popular than ever and with more money than ever, UEFA say that:
- 37% of clubs are in negative equity (their debts are more than their assets)
- the total income of all European clubs is 11.7bn EUR but the total costs are 12.9bn EUR
- no less than 7.4bn EUR of total costs are players wages
- The average club in Europe spends 64% of its income on player wages
- 73 clubs spend more than 100% of their revenue on player wages (note in 09/10 this included Manchester City)
UEFA want to start forcing clubs to live within their means, almost to save the clubs from themselves. It’s also no coincidence that the momentum behind UFFP grew during the global credit crunch that had been caused by too many people spending too much money today in the over-optimistic hope that they would have more money in the future and be able to pay it off later.
How Do The Rules Work?
All terms used in this section are defined in great detail in the UFFP regulations
Break Even Result = Relevant Income – Relevant Expenses
Deviation = SUM of BREAK EVEN RESULTS for each year in ACCOUNTING PERIOD
What is “Relevant Income”?
In a nutshell:
Revenue + Profit From Player Trading (Revenue is income from media, matchday and commercial)
NB: Profit from player trading is NOT as most football fans see profit on trading – more later
(There are a host of caveats and clarifications in the detail)
What is “Relevant Expenses”?
In a nutshell:
All Staff Wages + Cost Of Transfers + “Other Costs” (e.g. finance costs)
NB: “Other Costs” EXCLUDES the costs of youth/academy programmes, community programmes and stadium development [technical note from Graeme Riley – this also includes interest on the development, which can be capitalised and amortised, rather than immediately expensed].
This is because UEFA wants clubs to plan for the future by investing in these things rather than spending all their money on players wages.
The “Cost of Transfers” will be covered when later on when I talk about AMORTISATION. Understanding this as well as the profit from player trading is absolutely essential if you want to realise how FSG are likely to exploit UFFP.
What Are The Rules?
UFFP has “Accounting Periods” that are aligned to the UEFA licensing cycle and came into effect on 1st June 2011. The first “accounting period” is 2 years, 1st June 2011 to 31st May 2013. The niceties regarding exchange rates have been ignored for this article.
For each year in UFFP, a club’s “Break Even Result” is allowed to be up to a 5m EUR loss. This is known as “acceptable deviation”. Clubs are allowed to make bigger losses for “Accounting Periods” but only if their owners invest more of their own cash into the club to cover the loss.
For the first 2 year accounting period, clubs are allowed a maximum “acceptable deviation” of 45m EUR but owners will be tasked with finding up to an extra 35m EUR in cash to cover losses. The grey areas will start with aggregate losses >45m EUR and at what point UEFA will draw the line. The general feeling is that clubs who are significantly reducing their losses year on year will still be given a ‘pass’ (Annex XI of the regulations)
The first impact on licensing decisions will be in place for the 2014/15 season (i.e. the first time a club may be denied entry to the CL is 2014/15). Things get gradually stricter from that point on. The 2nd accounting period extends the 1st by a year licence (i.e. to May 31st 2014) and from this point 3 years’ worth of accounts are required to be submitted in order to gain a licence. However, acceptable deviation STILL an aggregate 45m EUR. Then there’s a rolling 3 year accounting period where acceptable deviation reduces to 30m EUR and finally to less than 30m EUR in 2018/19.
What About Liverpool?
The 2 articles below have recently looked at Liverpool’s last financial results in fantastic detail and are an absolute must read for those interested in off the pitch matters:
http://swissramble.blogspot.com/2011/05/liverpools-future-strategy.html
http://andersred.blogspot.com/2011/05/liverpools-200910-results-underline.html
The AndersRed article contains a detailed analysis of what our “Break Even Result” for 2009/10 might look like. The Swiss Ramble one takes a more forward-thinking look and outlines a 15 point strategic business plan. While taking a lead from both and summarising some key points, I believe I have one major advantage over Swiss Ramble and AndersRed in that I’m a Liverpool fan and consume Liverpool news and information in great detail every single day.
Based on their public statements about no deficit spending, it’s a reasonable assumption that FSG will be attempting to ensure Liverpool have a UFFP break-even result within the 5m EUR acceptable deviation. Therefore the rest of this article will look at two angles:
1) How to increase relevant income, particularly the importance of the Champions League and player trading.
2) How to reduce relevant expenses, particularly the “bad contracts” that John Henry has frequently talked about. As we can only estimate wages for most players, I will be performing a player/wage value analysis to show where FSG could look to make savings.
Liverpool’s “Relevant Income” for UFFP
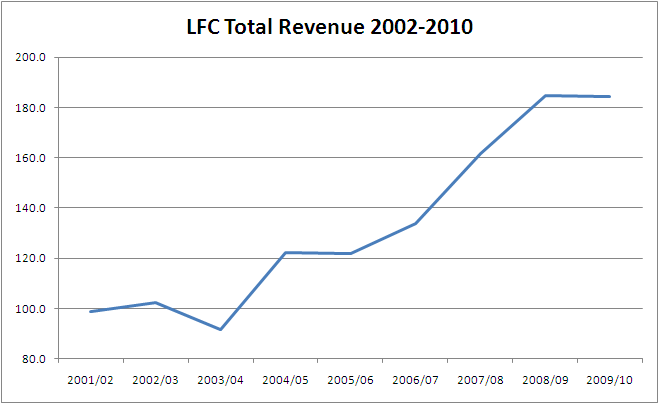
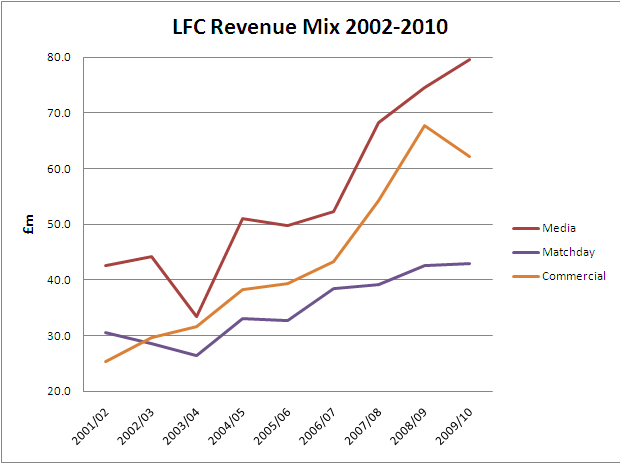
One way for FSG to ensure compliance with UFFP is to increase revenues. This is what they’ve done at the Boston Red Sox and fits with John Henry’s approach as quoted at the top of this article. Let’s look at the clubs recent financial results. Liverpool first started reporting revenue in the categories of Media, Matchday and Commercial in 2001/02. The results for all 9 seasons are:
Note 1: the CL revenue is estimated because UEFA annual reports were in Swiss Francs and now Euros. A relevant conversion to GBP has been done based on the exchange rate on 31st May of the relevant year using http://www.oanda.com/currency/historical-rates/. Also this is only CL TV money, NOT CL gate receipts or CL related payments from LFC sponsors. From the accounts there is no way to establish the whole value of the CL to Liverpool.
Note 2: in 2009/10 the revenue from the run to the Europa League semi-finals was a tiny 3.1m EUR compared to the 29.3m EUR from the group stage exit in the CL
Note 3: the ROTW commercial columns is the proportion of commercial revenues coming from outside the UK. This would appear an immediate area where FSG can look to improve.
The overall growth in Revenue during the Noughties is quite remarkable. In fact from 2003/04 the total revenue MORE THAN DOUBLED in just 5 years (£91.5 to £184.8m). [NB: Included in this are rises seen throughout football relating to TV deals.]
The 9 year trend shows a steady decline in the proportion of revenues that come from matchday (31% to 23%). This explains why the new/upgraded stadium remains at the very top of FSG’s to-do-list. Another reason why is because Swiss Ramble calculates that Man United and Arsenal earn £2m more than Liverpool in every home game.
In that same period, Media has remained in the low 40’s but Commercial has shot up from 26% to 37% in 08/09. Expect this to further increase in the 2010/11 results due to the Standard Chartered shirt deal (a £12m p.a. increase on Carlsberg) and from 2012/13 due to the Warrior kit deal (£13m p.a. increase on Adidas). The accounts put the 2009/10 decline in commercials down to “reduced merchandising” (e.g. many fans buying less in the final year of G&H), however the experts suspect clauses in sponsors contracts related to loss of CL football.
Over the 9 years, commercial increased by 167%, media by 86% and matchday by 40%
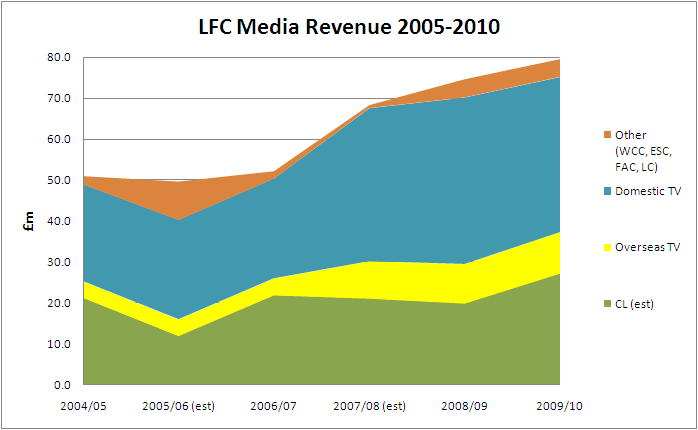
Throughout 2002-10, Media was the biggest proportion of LFC revenue. The tables below are a detailed look at the media breakdown from 2004/05 onwards.
Note 5: yellow cells indicate estimates as I’ve been unable to obtain a copy of the Premier League Annual Report for those years.
Note 6: Equal Share is the part of the TV deal distributed equally to all PL clubs. Facility fees directly results from the number of times you are shown live on TV and Merit Payment is the PL place money which is on a sliding scale from 1st to 20th.
Note 7: WCC = World Club Cup, ESC = European Super Cup, FAC = FA Cup, LC = League Cup
The thing that stands out is just how much of our media revenue comes from the CL. It’s a fair bet to say that the 2010/11 results where we are not in the CL will see Commercial overtake Media as the biggest source of revenue even though 2010/11 sees the start of a new PL TV deal period.
What’s most interesting here is that for the first time, the proportion coming from overseas is threatening to overtake the value of domestic rights. It’s also worth noting two things at this point:
1) The PL TV deals exclude mobile and online content, another clear immediate opportunity for FSG to focus on
2) The EU is currently hearing a benchmark case from pub landlady Karen Murphy that threatens the nature of all current TV deals. No-one yet knows the real impact if Mrs Murphy wins the case.
For the season just gone 2010/11, Liverpool’s revenue’s will almost certainly decline due to the absence of Champions League football. The amount of decline will be decided by how much cannot be offset by an increase in Commercial, although bonus payments from sponsors and facility costs are also likely to decrease.
For the upcoming season 2011/12 season and the start of UFFP, revenues could return to 2008/09 and 2009/10 levels thanks to the new PL TV deal but due to lack of CL once more, it’s unlikely that there will a return to 20% year on year increases as seen in recent times.
For much more on how Liverpool could increase revenues please see the Swiss Ramble article.
Liverpool’s “Relevant Expenses” for UFFP
With revenues unlikely to increase for the first year of UFFP it becomes critical for the club to cut relevant expenses to reduce the risk of breaching “acceptable deviation”. John Henry has talked on a number of occasions about “bad contracts” and the poor value/depth of the squad for the size of the wage bill we have. Both Swiss Ramble and AndersRed show how the Liverpool compares unfavourably with our top 6 competitors, not least the seemingly rampant wage inflation of recent years. Our latest wages to turnover ratio is the highest it’s ever been at 62%, edging toward the UEFA “red flag” level of 70%. Our aspiration should be to become a lot leaner like Spurs who have a similar cost of squad with arguably better depth but with only 60% of the wage bill.
An aside here is that the leanness of the Spurs wage bill is no surprise given the acumen of Daniel Levy and the amount of players traded during the Damien Comolli era, hopefully Liverpool will benefit in the same way over the coming years. [PT: Spurs may have more wage issues now that they have participated in the Champions League, from which players expect reward. Having attained a new level of success, their players are in fresh demand, and it may take pay rises to keep them happy. That said, Spurs have a good recent record of selling and reinvesting the money. But looking at when the wage data dates back to, they were still not a ‘Champions League club’]
The notion of “bad contracts” got me thinking, is there any way we can try to demonstrate what this means? At Hewlett Packard, where I work as a data analyst, we define new measures all the time to identify and track what is important to us. My idea was to create 2 new measures and plot them to see if this could be used as a way of identifying “bad contracts”. In both cases, “Long Term” means 5 years:
1) Long Term Contract Commitment (LTCC)
A simple measure based on information that is in the public domain.
LTCC = Number of Full Contract Years remaining x Estimated Basic Annual Salary
For some players this is readily available e.g. everyone knows that Joe Cole is on £90k a week. For some, particularly the recent contract renewals and new signings under FSG, it is not made public at all (something that I do welcome) and estimates have been made.
2) Long Term Player Value (LTPV)
Elements of this measure are subjective. The primary elements are a players AGE and QUALITY (the subjective part)
Age has been scored as follows: under 23 (5), 24-25 (4), 26-27 (3), 28-29 (2), Over 30 (1). Goalkeepers receive a bonus point due to their longevity
“First Team Quality Estimate” has been assessed as follows:
- World Class (acknowledged world class level performer) = 5
- Top International Class = 4 (not every international will be rated as this. It’s more for the “best” players from the “top” countries)
- Established Premier League performer = 3
- Fringe international = 2
- Club (or Youth) level performer = 1
An additional multiplier is then applied for “fitness risk”.
- High Risk means likely to miss up to 50% of games through injury and multiplier is 0.7
- Moderate Risk means likely to miss up to 30% of games and multiplier is 0.9
- Low Risk multiplier is 1
LTPV = ((Age rating + Goalkeeper Bonus) x First Team Quality Estimate) x Fitness Risk
The basic framework was taken from this web page and then refined as much as possible through internet research. If I was presenting this in my day job I’d say I had an 80% confidence level in its accuracy – sufficient that any inaccuracies are unlikely to have a significant impact on the results.
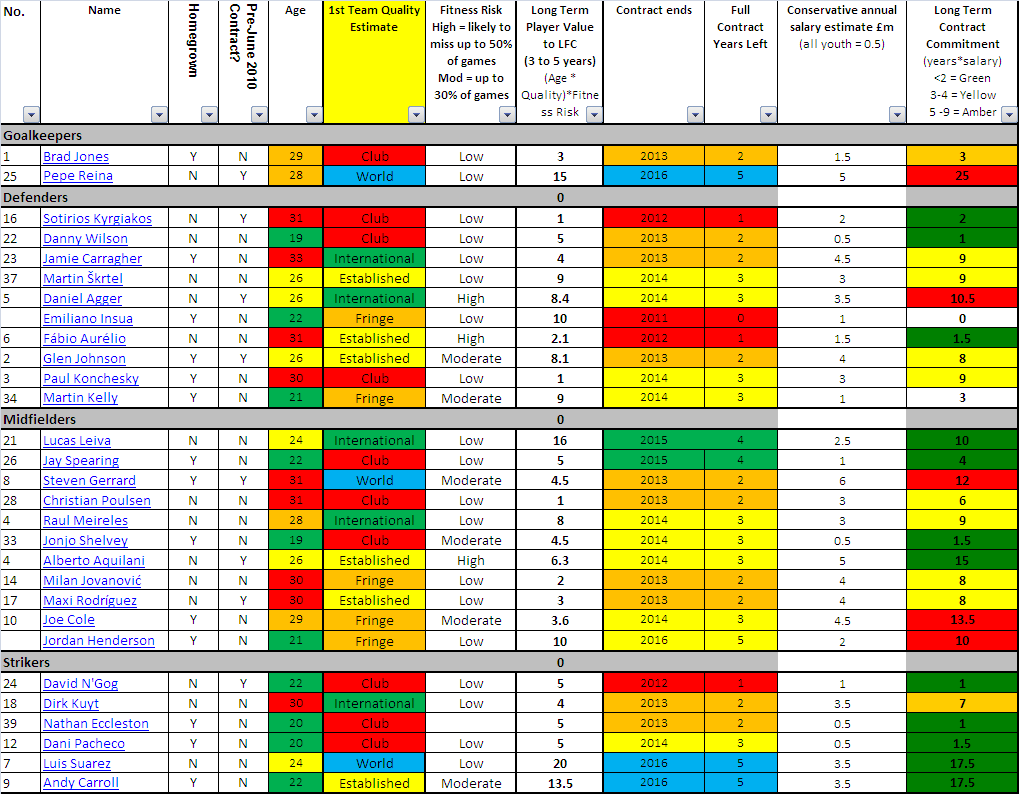
Click to open larger image in new window.
The colours are used as indicators specifically relating to each column of data. The purpose is to allow for a targeted deeper analysis of the ‘red’ cells and maybe the ‘oranges’ too. For Age it’s simple, the ‘red’ zone is over 30, for contract length it’s any player with contract ending in 1 year, for LTCC it’s any contract with a total monetary commitment over £10m.
Examples of deeper analysis could be:
1) for LTCC. It’s important to understand what is driving the high monetary value. Is it annual salary, length of contract or both? Management focus should be on players with high LTCC because of the former.
2) For Age, not all 30 year olds are ‘melting’ at the same rate. Contrasts would be Joe Cole and Steven Gerrard with Ryan Giggs and Gary Speed. The indicator would flag up the need to go and investigate other data sources before making a decision
Some ‘reds’ are also red herrings. e.g. Pepe Reina. His LTCC may be £25m but he also has the 3rd highest LTPV behind Suarez and Lucas . So in short, don’t focus too much on the colours in this chart, instead focus on the results when LTPV and LTCC are plotted against each other on the chart below.
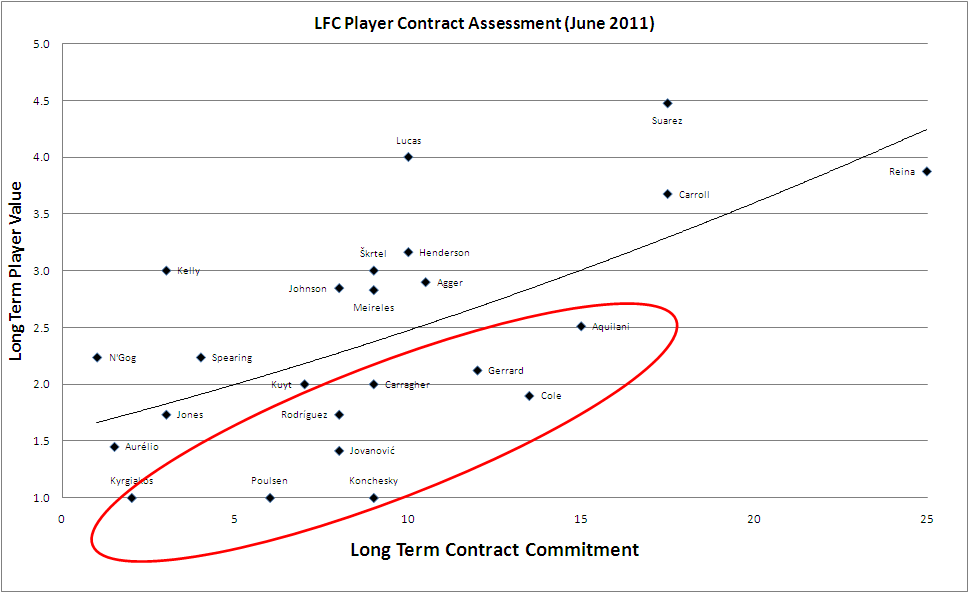
With some invaluable consultancy from Zach Slaton, the data was transformed to make it ‘normal’. In the final chart below, the square root of the LTPV is used
Click to open larger image in new window.
The key is the distance from the line. Those far above the line like Kelly, Lucas and Suarez need to be retained at all costs. Looking at the chart, it’s interesting that most of players above the line have signed contracts under FSG: Kelly, Spearing and Lucas have extended plus Henderson, Suarez and Carroll. Only one player who has signed under FSG is below the line and that is Kuyt and even then it’s marginal.
However the exceptions are Ngog, Johnson, Skrtel, Agger and Meireles. If we examine the reason for the distance from the line we can make intuitive decisions about what needs to be done next. The reason for Ngog and Johnson is shortness of contract remaining. Based on this fact, both need to be re-signed on a new deal ASAP or sold.
Meireles, Agger and Skrtel fall into a different category. They all have 3 years remaining but they all have significant resale potential. I fully expect all 3 to be the subject of significant internal discussion about whether we cash in or retain.
“Bad Contracts”?
After defining the measures and collecting the data, my conclusion of what John Henry meant by “bad contracts” is the red ellipse on the chart. And yes that includes Steven Gerrard.
Nine first team players, with a cumulative estimated weekly wage of over £700,000 PER WEEK. Or £3m a month. Or about £36m a year.
Just what kind of return are we getting from those 9 players for c£36m p.a.?
Especially when you consider that these players are supposed to be the senior players in the first team and taking responsibility in the drive to make the club successful
Of the 9, 7 of them are already 30 or over (Joe Cole is only 6 months away). Only Aquilani has age on his side at 26 (hence his slightly higher LTPV but not enough to justify his LTCC)
Contract length remaining is critical for 3 players: Konchesky, Cole and Aquilani all have 3 years left so they are likely to be the highest FSG priority for resolving.
Those with 2 years are Gerrard, Carragher, Rodriguez, Jovanovic and Poulsen. Carragher and Gerrard are assessed as having a “First Team Quality Estimate” of international or above but both are borderline. Those assessments, plus the number of first team games they can still play – and make a difference in – should mean they are excluded from this Summer’s transfer plans.
If I was looking at this as presented and with no idea of who those players were then I would conclude that none of them would be offered another contract when their current ones expired – and yes, that includes Steven Gerrard.
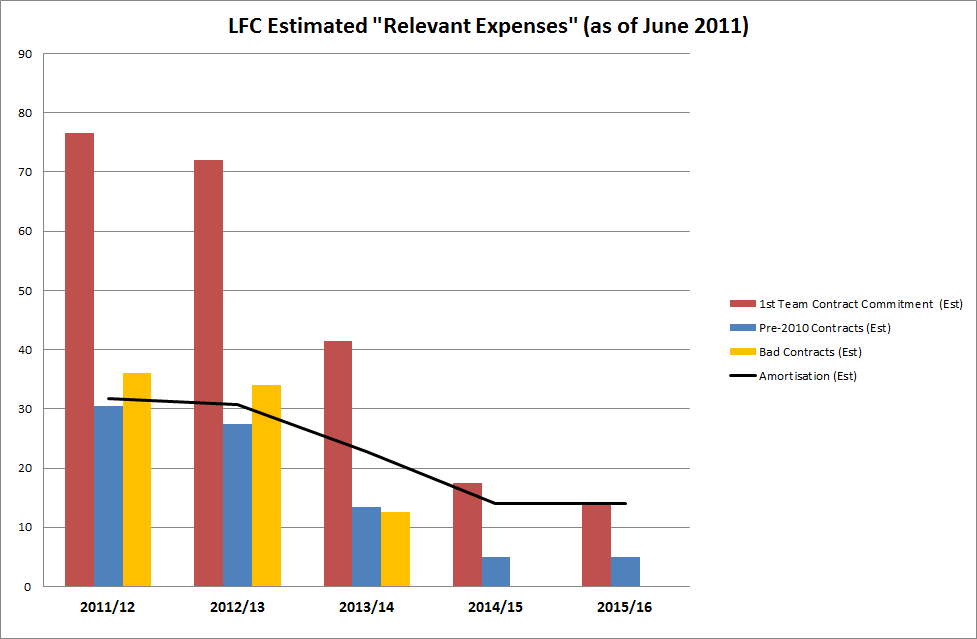
The chart below shows how much of our total wage bill (players, manager, directors, coaching staff, reserves and youth – including bonuses) is consumed by the estimated basic salary of the first team squad. Of those you can see how for 2011/12 and 2012/13 about half could be considered “bad contracts” (and they don’t disappear completely until 2014/15 season).
The other bar on the chart is the potential UFFP “joker in the pack”. There is an annex in the regulations that states that pre 1st June 2010 contracts will be excluded from the break-even calculation (because UFFP was only finally approved in 2010). Of course pre 1st June 2010 contracts will eliminate over time but in the first two years of UFFP, Liverpool could have almost an aggregate of c£56m potentially excluded. It’s also worth noting that thanks to Pepe Reina’s 6 year contract signed in April 2010 we have c£5m get out of jail card right up to 2015/16.
The line on the chart brings me to the final part of this article: how the cost of transfers is handled.
A Different Way Of Thinking About Player Transfers
Under UFFP, players are assets and player transfers are handled following standard accounting practices for fixed assets. The transfer fee for a player is written down (amortised) over the length of his contract. Let’s take the example of our most expensive player, Andy Carroll.
As we all know, he signed for £35m on a 5.5 year contract which is an amortisation of £6.36m per annum.
£6.36m will already have been charged to the Profit & Loss Account in 2010/11 and £6.36m will be charged every season until he leaves the club or signs a new contract.
Liverpool also have some other very big contributors to amortisation in 2011/12: Suárez £4.2m, Johnson £4.5m, Aquilani £3.6m [technical note from Graeme Riley – fee to be amortised is £18m. Add-ons will be separated out under “contigent liabilities”] and Henderson £3.2m (£16m over 5 years).
However, consider this. By the end of the first accounting period 1st June 2013 Carroll will be 24, Suarez 25 and Henderson 22. Yet their transfer values will have been amortised by £19m, £12.5m and £6.4m respectively. On the Liverpool books the player’s values would be:
- Carroll – £16m
- Suarez – £10.3m
- Henderson- £9.6m
Yet all would still have 3 years left on their contracts and in football terms, yet to hit their peak years a fantastically strong position that could only be undermined by (1) catastrophic injury (2) The three turning out to be duds.
Right at the start, when I explained about “Relevant Income”, I mentioned how under UFFP, profit from player trading counts as income alongside things like TV money.
The best example of this happened this season. Under UFFP, Ryan Babel would have made Liverpool a profit on player trading.
How I hear you say? Well we think of profit as what we received minus what we paid but this isn’t how player sales are calculated for profit (or in Babel’s case it’s the other way around – a loss). As Swiss Ramble explains, in 2007 we signed a 20-year-old Babel from Ajax for £11.5m on a 5 year contract so the amortisation was £2.3m a season. After 3.5 inconsistent seasons his value on the books was just £3.4 million. His £6m transfer to Hoffenheim will actually bring a £2.6m profit to next year’s accounts.
The same method will mean approximately £13m profit for Mascherano (value on the books down to £4.5m) and somewhere around £42m for Torres. This means that the 2010/11 accounts (the year before UFFP) are going to see a huge profit on player trading of c£58m, when in reality we know that the cost of Carroll and Suarez was almost exactly offset by Torres and Babel. Accounting eh?
The same practice also gives us a clue as to what could happen with Alberto Aquilani. As we speak, his value on Liverpool’s books is c£10.8m (18-((18/5)*2)). A transfer fee of 12m EUR this summer would ensure no loss counting towards year 1 of UFFP. Another option would be ANOTHER year long loan followed by a cast-iron, unbreakable commitment to buy at, say, 8m EUR. Madness I hear you cry! But from a UFFP perspective, c£5m would be saved in wages during year 1 and a sale at his accounting value would ensure no loss in year 2.
Conclusion
Based on Liverpool’s last set of accounts (2009/10), our elements for a high level UFFP equation were:
Relevant Income = £184.8m (Revenue) + £22.8m (Profit from player trading)
Relevant Expenses = £114.3m (Wages) + £40.2m (Amortisation) +£27.7m (Other Costs)
£207.6m (Relevant Income) – £182.2m (Relevant Expenses) = £25.4m
(Note for those wanting to see an incredibly detailed assessment of how the UFFP break even results might look for the top 6 clubs please see http://andersred.blogspot.com/2011/04/financial-fair-play-crunching-numbers.html)
Obviously this ignores things like interest paid under Gillett and Hicks, but fingers crossed that is a thing of the past going forward under FSG.
The interesting thing is that without the profit from player trading (mainly Alonso in this case) we’re getting close to making a loss.
Then you need to factor in the loss of the Champions League: a minimum £25m in TV money plus gate receipts and extra payments from sponsors. No wonder it’s estimated that our replacements in the top 4, Spurs, made a total of £39m from their run to the quarter finals last season.
When the 2010/11 accounts are published in May 2012, the loss of the CL will not be apparent in the bottom line because we will make almost £50m profit on player trading.
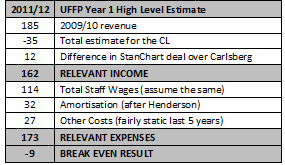
However, for year 1 of UFFP things looks more serious. If we take that Spurs figure as a benchmark then all of a sudden Liverpool are in the UFFP red zone:
There’s going to be deductions for the academy and pre-2010 contracts (such as the earlier example of £5m per season for Reina) but it shows you how borderline the situation is. Every expensive transfer will increase amortisation. Every dead-wood player that isn’t moved on maintains the wages.
The only players who will yield an accounting profit in 2011/12 are those “above the line” plus the unpalatable prospect of selling academy players. Ngog’s value on Liverpool’s books is c£350k, Agger c£600k, Lucas c£900k, Kuyt c£1.1m and Skrtel c£1.6m.
If the status quo is maintained, FSG are facing the prospect of writing a hefty cheque to cover the loss above 5m EUR – something which they will be extremely reluctant to do given their policy on deficit spending.
On the other hand, with a successful cull of the wage bill the scope for further signings increases again. Even getting rid of Cole, Jovanovic, Poulsen, Konchesky, Rodriguez and Kyriagkos on free transfers will free up about £20m in wages to be used for new player wages and the first year’s amortisation on new transfers. Any transfer fee for any of those players would be a bonus.
It’s not all bad news though. The problem most clubs face is lack of cash flow to make transfer signings happen in the first place. FSG appear to be the opposite – a cash rich organisation who will not have any problems meeting onerous up-front payment terms when buying new players.
When they took over Liverpool, FSG talked about needing 3 to 5 years to make Liverpool genuinely competitive again, both domestically and in Europe. After even this high level look at the figures it’s easy to see why. For the next couple of years, FSG are going to be very, very busy.
PS: to pre-empt the eternal question of how this compares against the other two clubs…I refer you back to the experts:
http://swissramble.blogspot.com/ Twitter: @SwissRamble
http://andersred.blogspot.com/ Twitter: @AndersRed (he’s a Man United fan but still worth a follow)

