If the dropped points against Fulham and Crystal Palace could have been swept under the carpet under different caveats, nothing of the sort can come to this Liverpool team’s rescue after their hapless performance and defeat at the hands of a fired-up but below-average Manchester United team.
Teams can lose games, but the communication breakdown and lack of basic application by the Reds at Old Trafford throughout that game was painful and alarming to watch.
OK, some of the basics were absent against Fulham too, though the Palace game was a weird one in which the Reds played well yet got carved open easily and missed some glorious chances, especially before the Darwin Nunez red card.
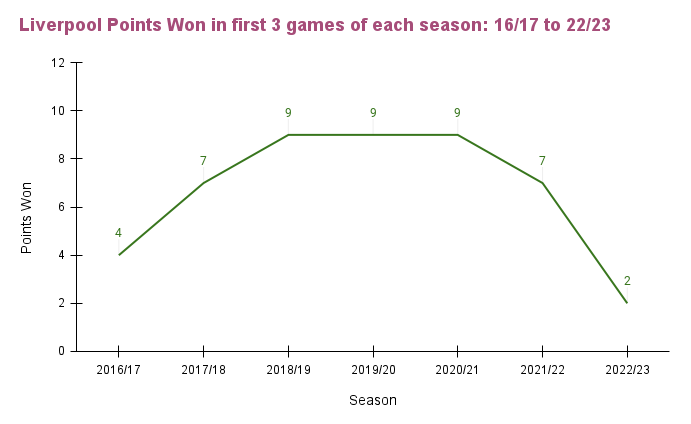
All of that has led to this being the worst start to a league campaign under Jürgen Klopp, in this his seventh full season in charge.

This article will focus on the first three games of each season under Klopp, with the help of underlying and in-depth stat metrics to make sense of this start.
All the stats for the analysis are taken from Wyscout, charts are made by Mizgan Masani using Excel charts. Please credit him if any chart is taken from this article to publish elsewhere.
The rest of this article is for TTT Subscribers only.
[ttt-subscribe-article]