
The final phase of the Premier League season is here with most teams left with seven or eight games to play. This is an ideal time to do an overall comparison between Liverpool and the rest of league on key metrics from attack to defence. It will give us an idea of whether teams are in their right place in the table. They mostly are at this stage of the season anyway.
Earlier in the year (late February), during the attack and defence metric analyses of Liverpool, they were touted to be on course to cross the 100 goals scored mark. That projection has dropped to 98 at the moment with eight games left. Now, that is not really an alarming drop-off by any stretch.
Moreover, they have conceded just one goal in the five league games since. So, in contrast to first half of the season, where they needed 2+ goals to win games, the Reds can now collect three points by even scoring one or two goals max.
With some sort of background set, let us dive into a plethora of data viz to make comparisons of the Reds with other Premier League teams. Every viz will be explained as to what it shows, so that it has the required meaning to boot.
Please note that these stats were taken before the Burnley v Everton game (not that it affects the analysis towards Liverpool).
General Metrics
Starting with the points and expected points metric:
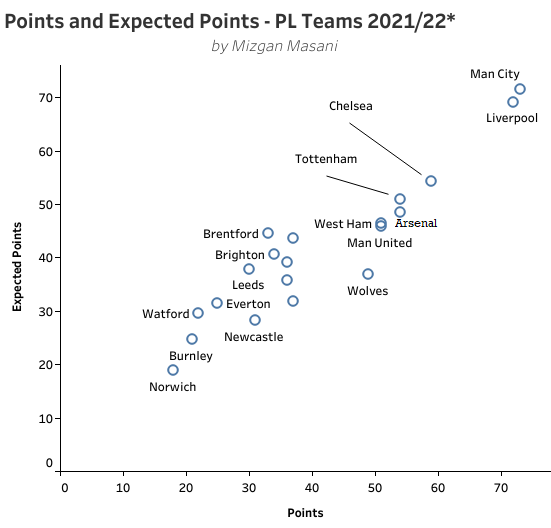
Manchester City just edging Liverpool in both actual and expected points. The duo are of course clear of the rest of the league by a long margin. It also shows how big the game on Sunday is, more so because they both are expected to be in the top two and beating other teams after that game. Whoever wins it may tilt the race in their favour big time.
“Expected Points measures the number of points a team could have expected to have taken from a game, based on the scoring opportunities (xG) that they created and conceded in that game.” (Courtesy – xGPhilosophy)
Attacking Metrics
Basic one to start with – goals and expected goals on a per 90 basis to get more meaning as not all the teams have played equal amount of games.
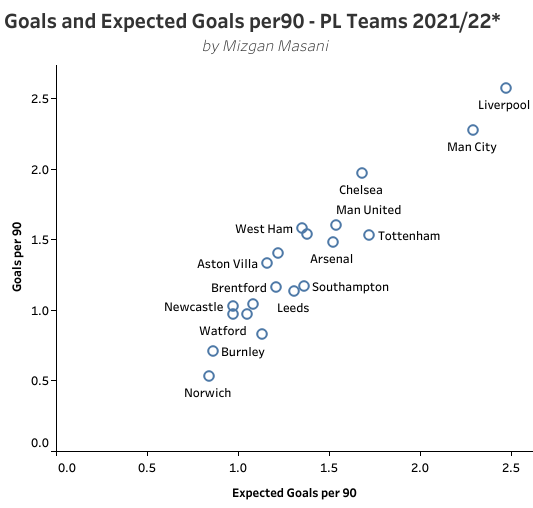
Liverpool are leading in goals and expected goals per 90 despite them scoring at two per game in the last five games, contrary to their season average of 2.57. They have those five exceptional forwards who can score and win them games at any juncture.
Chelsea have been one of the teams who have overperformed the expected numbers by a decent margin. They have been on 1.68 expected goals per 90, but the actual goal-scoring rate is at 1.97.
Next up, we have shots taken and quality of shots.
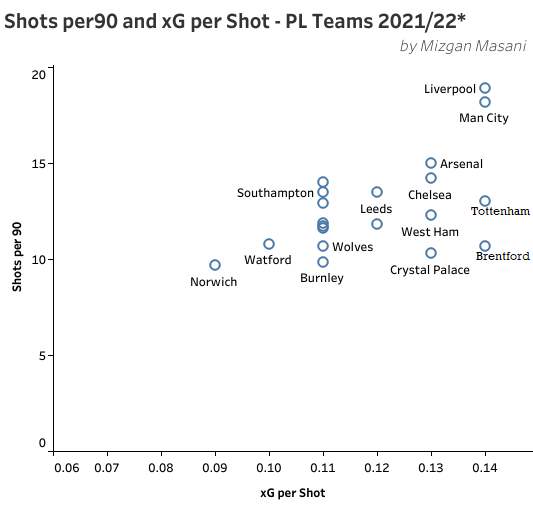
Liverpool are leading the league in shots attempted per 90 with 18.9, and have the joint-top xG per shot as well (0.14). It means every seventh to eighth shot of theirs is a goal. Now considering they take an average of 19 to 20 shots per game, going at an average of 2.57 goals scored per 90 is happening by no luck or coincidence. Quality players having this high volume of shots would only result in high goal returns.
The xG per shot also shows why Spurs are doing well goal-scoring wise (fourth best scorers in the league). Despite them taking almost half as many shots as Liverpool (10.5), their xG per shot is same as the Reds. So, they are able to score three goals every two games at the rate of 1.50 (their season average at the moment).
Set-Pieces
Next up, we have the goal scoring from set-piece situations.
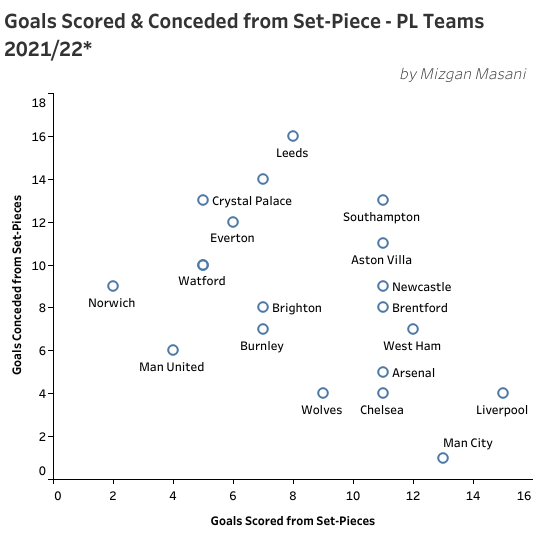
The Reds lead the goals scored from set-pieces with 15 and have conceded the joint second-fewest with four. So they are +11 from set-pieces goal difference which is always handy during the course of the season. Jurgen Klopp is massive on making set-pieces, be it corners or wide free-kicks, count for as much as it can. At the moment, they are scoring a goal every two games using this tool. Top-quality delivery from the fullbacks really helps.
Off the Ball and Defensive Metrics
First up in this section we have the duo goals and expected goals conceded per 90.
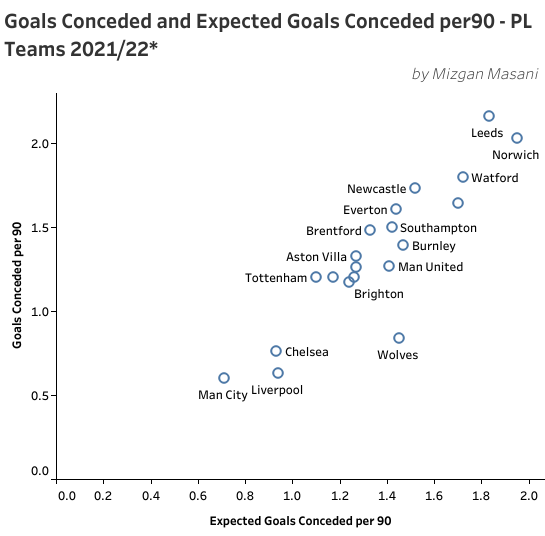
Manchester City and Liverpool have the fewest goals conceded, with 18 and 20 shipped from 30 games respectively. Chelsea are doing well in this section despite that crushing 4-1 defeat to Brentford, with 23 goals conceded now from 29 games. Their expected goals concession is at par with Liverpool. But the Reds have the best keeper in Alisson who makes incredible saves to keep his sheets clean.
Wolves do have the fourth-best defensive record, but their expected goal concession numbers are mid-table worthy. They do a good job of hanging in there despite giving up chances.
Next up, we have the challenge intensity and PPDA metrics to look at.
“Challenge Intensity is a team metric, quantifying how many defensive actions (defensive duels, loose ball duels, interceptions, tackles) a team is doing per minute of opponent ball possession.”
“PPDA is Passes Allowed per Defensive Action. It is a measure of how many passes a team allows the opposition to make before making any attempt at a defensive action. Colin Trainor (one of the top data-driven analysts from N. Ireland) in 2014 said PPDA is a metric to quantify high press intensity of a team.”
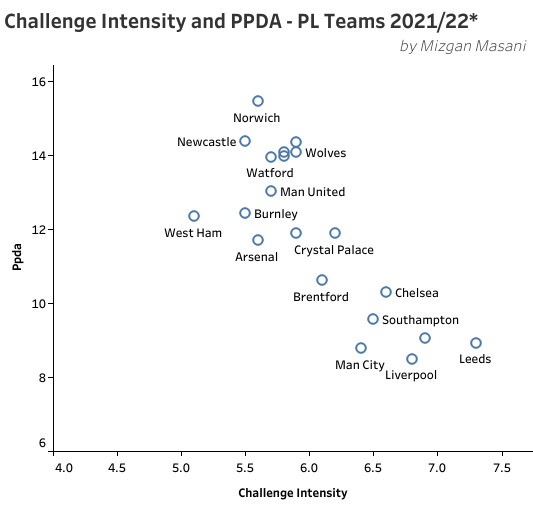
Liverpool have the least PPDA, meaning they are allowing the least passes among all the teams before making that pressure or a defensive action. Their pressing game and intensity has been on a great level this season, much to do with centre-backs playing in their right positions and the high-line being back in action. They are third in challenge intensity, with Leeds and Brighton leading in that particular metric.
Klopp has got that pressing and counter-pressing machine going pretty well this year.
Next up, we have the shots concession chart.
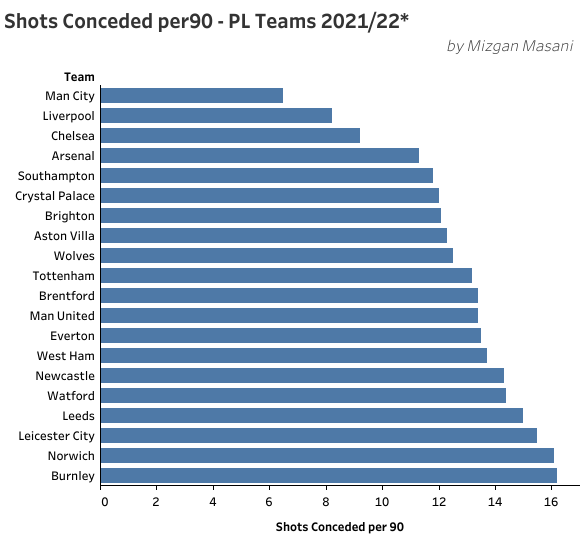
The top three defences in the league have the fewest concession of shots among all. Especially for the top two, they defend from the front very well and hardly allow opposition to enter in their own half, let alone allowing multiple shots on goal.
Manchester United are below mid-table in this, owing to their lack of control in games and a leaky back-line.
Action Zones and Discipline
The next viz is about how much percentage of time teams spend themselves in the final third of the opposition half. Along with it, the offside catching metric, showing how many times teams have caught opposition offside so far this season.
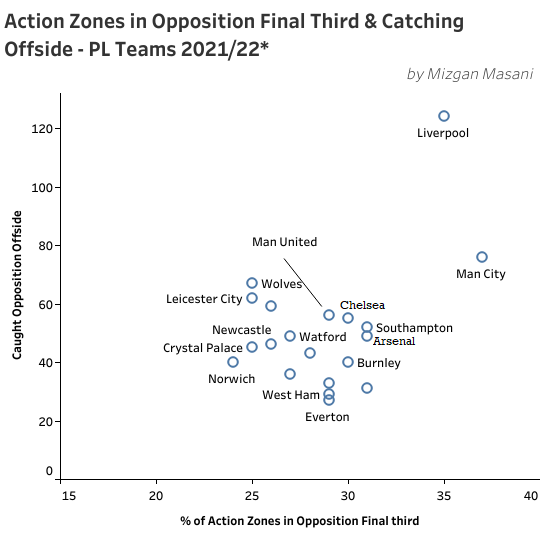
Liverpool are serial leaders in catching opposition offside with no one even coming close. It shows how well the high-line is working along with high-pressing and great counter-press. They are only second to Manchester City in terms of most of their action zones being in the opposition final third. No wonder these two dominate games so much and suffocate teams in their own half.
Lastly, we have the yellow card table to see where each team stands.
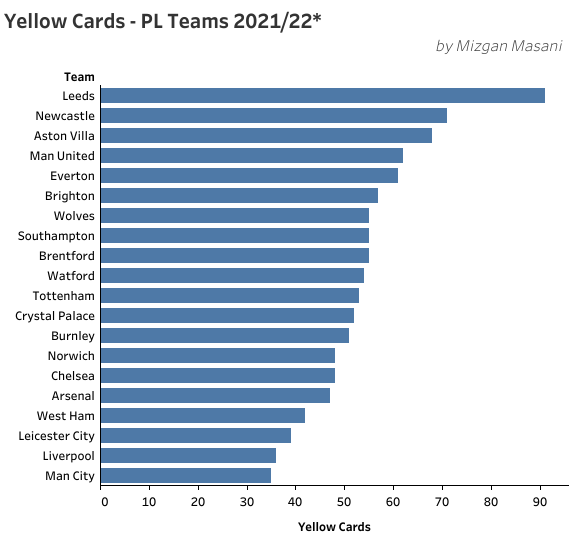
Liverpool have the joint-best disciplinary record in terms of yellow cards taken. But I am still shocked to see how City are there with the least yellow cards. They really do master at making tactical fouls in areas of the field where referees allow them 2 to 3 fouls per player before even thinking of booking. Would be surprised if this is not the part of their plans in every pre-game chat.
Overview
With a high dose of data viz on various metrics, we can safely say all teams in the Premier League are where they are supposed to be. It also showed how Liverpool top or in the top bracket of most metrics, which is always a good sign for the team. With eight games to go, there is everything to play for. Sunday will really decide a lot! Fingers crossed.
Data collected from Wyscout, Understat, FBRef and Whoscored for the metrics.