
We’ve had seven rounds of football so far, and the usual suspects are already firing along nicely at the top of the table, with the big four in places 1-4.
Everton, Brighton and the excellent Brentford make up the next three, and they have all been beaten just once, with a number of strong sides forming just below them, giving this season’s table a very tough look. If perennial Champions League qualifier hopefuls Leicester sit in 13th after seven rounds, you can sense it’s a tough old year.
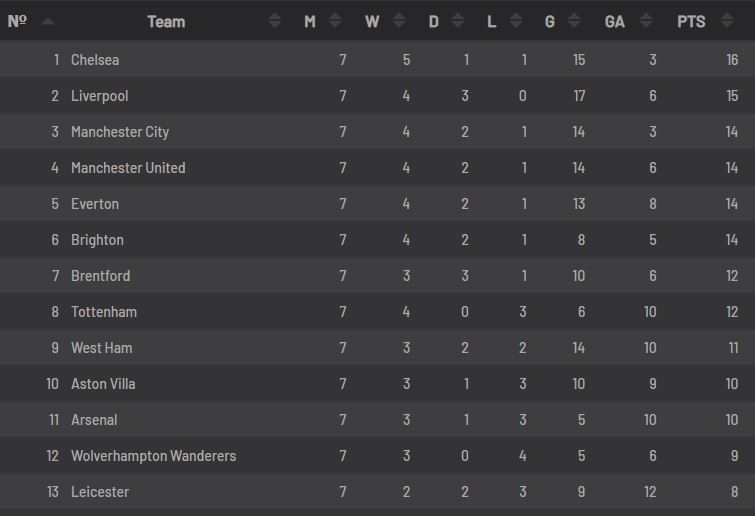
So on the face of it, we have four very evenly matched teams at the top, a little group of hopeful hangers on, and a bunch of good quality teams trying to string results together to shoot themselves up the table.
It’s the four supposedly evenly matched teams at the top that we are mainly looking at in this discussion.
I say supposedly because with just 2 points separating them they appear, on paper at least, to be of a par quality so far, with none of them showing a quality beyond the others.
Now before jumping into this season’s xG data, lets do a little bit of history work:
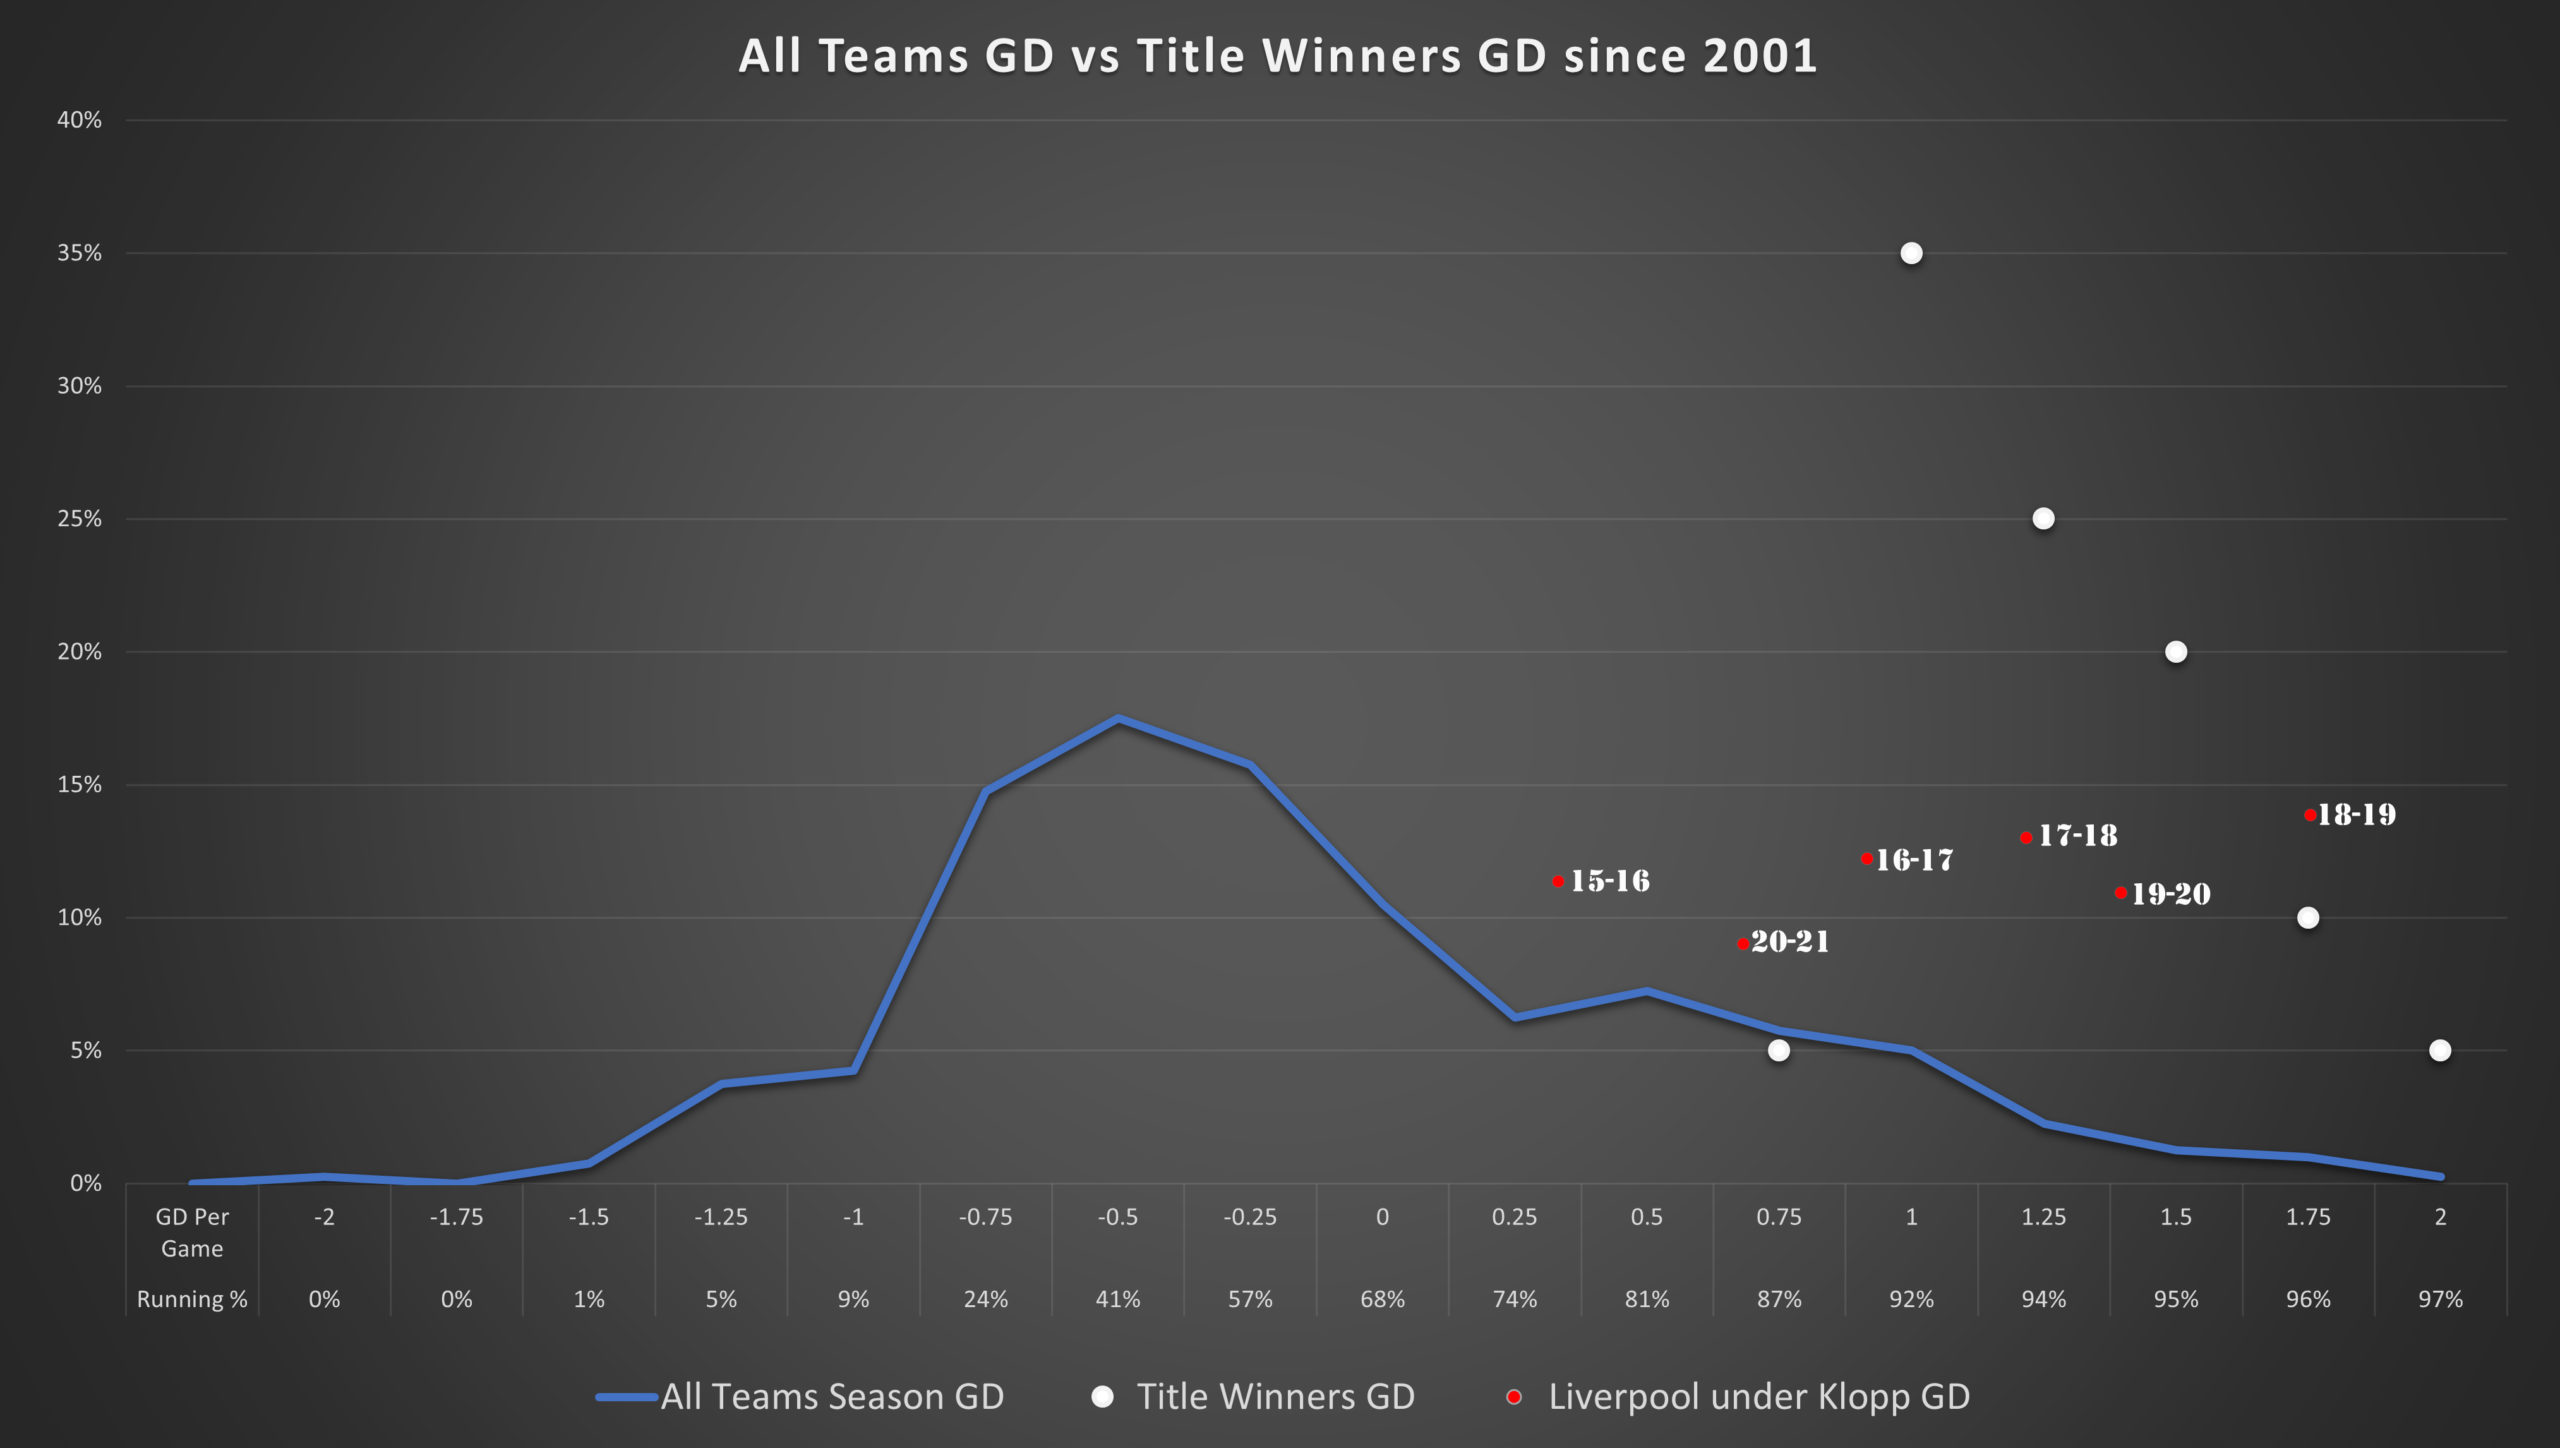
For context, above is a chart of Title Winners’ historical goal differences. (It’s calculated by taking Goal Difference and dividing by 38 games, to get a per game Goal Difference percentage – so if you score 60 and concede 22, your goal difference is 38, giving you a goal difference per game # of 38/38 = 1. On the above chart, the white dots are title winners’ GD # and the percentage of times this occurs, so a goal difference per game of 1 was enough to win you the title 35% of the time since 2001.)
It shows clearly that title-winners need to be, at least, one goal better per game than their opponents to get into title-winning territory. The data goes back twenty years and the only time this trend was bucked was the miracle of Leicester in 15/16, where they won the title with a GD of just 32, or 0.84 per game. They are represented on this graph as the left most white dot.
The rest of this article is for TTT Subscribers only. You can sign up for content like this for just £5/month.
[ttt-subscribe-article]