
Wherever Liverpool had ultimately finished in the league in 2019/20, there’s no doubt this would’ve been one of the most memorable seasons of your life. Can you remember those dim and distant August days – in 2019, not this year – when your greatest concern was how the VAR system was being implemented? Wasn’t life simpler way back then?
With that and a global pandemic to contend with, it was a season unlike any other. And thankfully it was one of the 19 to date in which the Reds were crowned champions of England.
So it’s time to lift up the bonnet on the red machine and check how it’s powered, and if it ran as well as it should have. These round-ups have included other competitions in the past, but on this occasion it’s only right to make it purely about the title winning Premier League campaign.
Expected goals
The following graph plots the expected goal statistics (via FiveThirtyEight) for Liverpool’s league games, with the icons colour coded by the match result, and lines drawn to indicate the boundaries for an xG win, draw or loss.
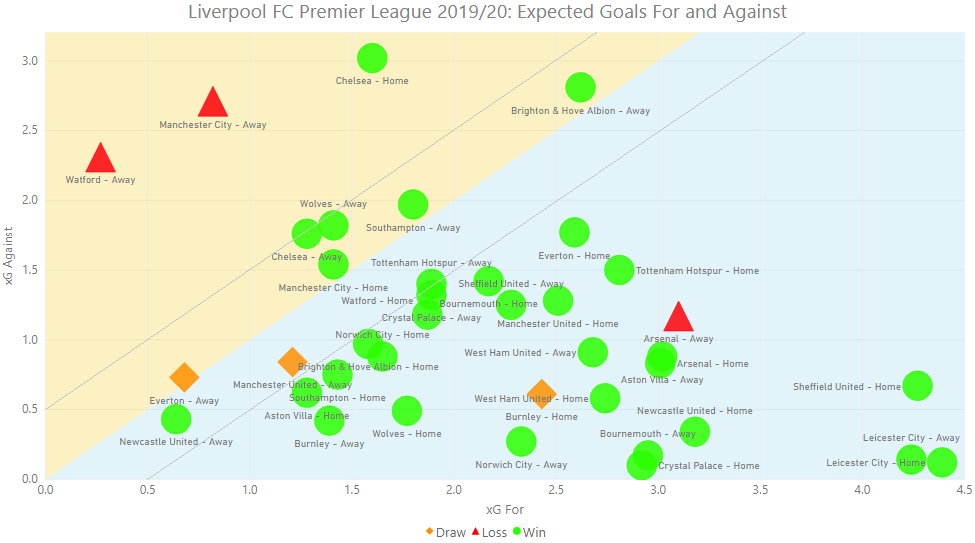
In the 31 games it took for Liverpool to secure the title, there were only five where the match result of win, draw or loss did not tally with the implied outcome from the underlying statistics.
Yet this particular discrepancy occurred in each of the Reds’ final five matches of the season. Perhaps this is what happens when a team which thrives on the controlled order of dominating games has nothing of significance to play for?
The rest of this article is for subscribers only
[ttt-subscribe-article]