
By Liverpool historian, and TTT subscriber Terry Dolan
Game 34, Liverpool’s Best Ever Season
This is Liverpool’s best ever season by several key measures. Sometimes you wouldn’t know it if you just listened to the Liverpool fans on social media! The broadsheets also seem somewhat stingy with their praise for Liverpool, blinded by their love-in with City. Ok, every Liverpool fan wants to win something this season – especially the league. But even if we win nothing this is still one of Liverpool’s best ever seasons.
I’ve been playing with the data (with some new data visualisations) to try and illustrate just how good this season’s performance has been.
Let’s start by comparing this season to Liverpool’s own illustrious history, including 18 league titles. Here is a ‘swarm plot’ (so called because it looks like a swarm of bees) showing Liverpool’s points total at game 34, across all top flight league seasons, from 1894-95 to 2018-19. Each data point represents 1 of 101 league seasons. If the same points total is achieved in more than one season then the points ‘stack’ horizontally, giving a view of the most common totals. The graph also highlights the seasons in which Liverpool won the title. As you can see, this season is out on its own, right at the top.
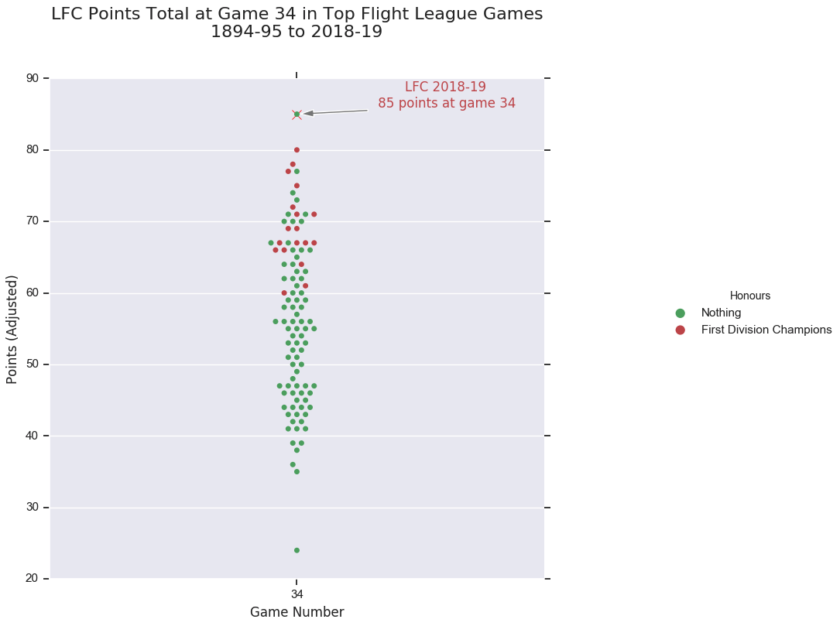
The swarm plot shows that Liverpool are currently (at game 34) ranked first for points when compared to LFC history. That makes this team better than every other Liverpool team in every other season. Here is a chart showing how Liverpool’s rankings in key criteria (points, goal difference, goals for and goals against) have changed with each game over this season.
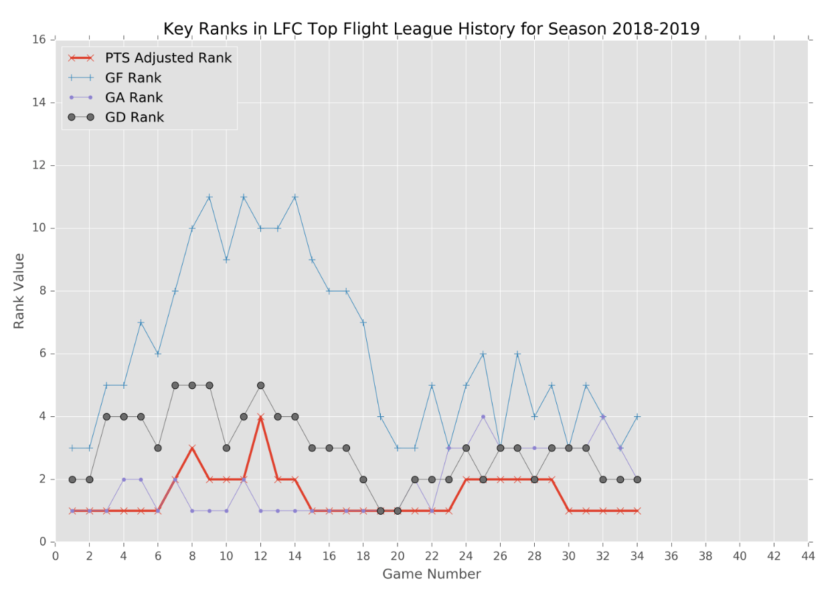
At game 34 this season is ranked first for points (adjusted to 3 points for a win), second for goal difference (the best total is 58 in 1987-88), second for goals against (the best is 14 in 1978-79) and fourth for goals for (the best is 93 in 2013-14).
A really good way of looking at trends is to plot the rolling 38 game points total, a whole season’s worth of games. Here is how Klopp compares (up to this season, game 34) to Dalglish and Paisley, Liverpool’s two most successful managers.
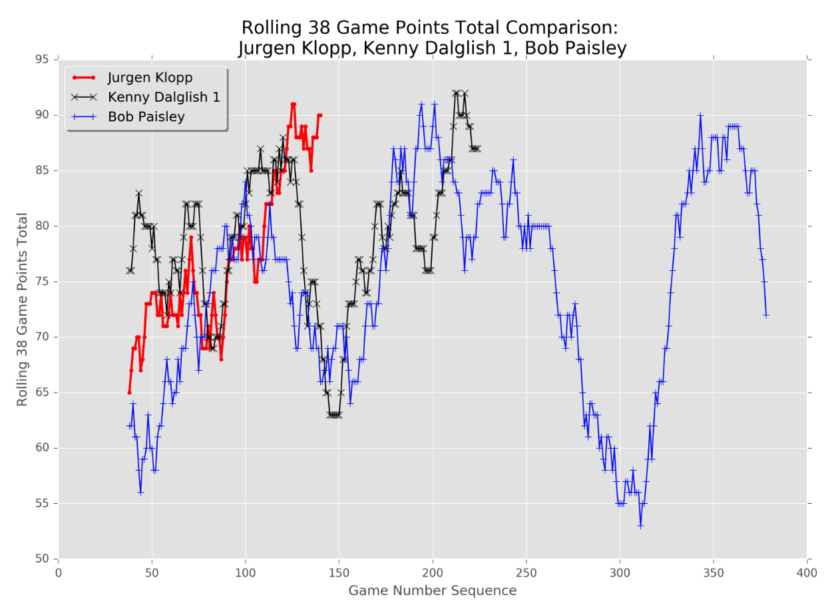
Klopp’s season on season improvement is remarkable. Liverpool are now hovering around a rolling 38 game total of 90 points. This total has previously only been achieved twice in Liverpool’s history – by Paisley (1978-79 and 1982-83) and Dalglish (1990-91).
I really like comparing Liverpool to the great teams of the 70s and 80s because I grew up watching those teams. If a modern Liverpool team compares favourably to (say) Paisley’s great 1978-79 team then we are in a good place! However, in order to understand just how good this team is, it is also essential to compare Liverpool’s performance to the best PL teams. Here is the swarm plot showing the points total for all PL teams in all PL seasons (1992-93 to 2018-19) at game 34 – that’s over 500 data points.
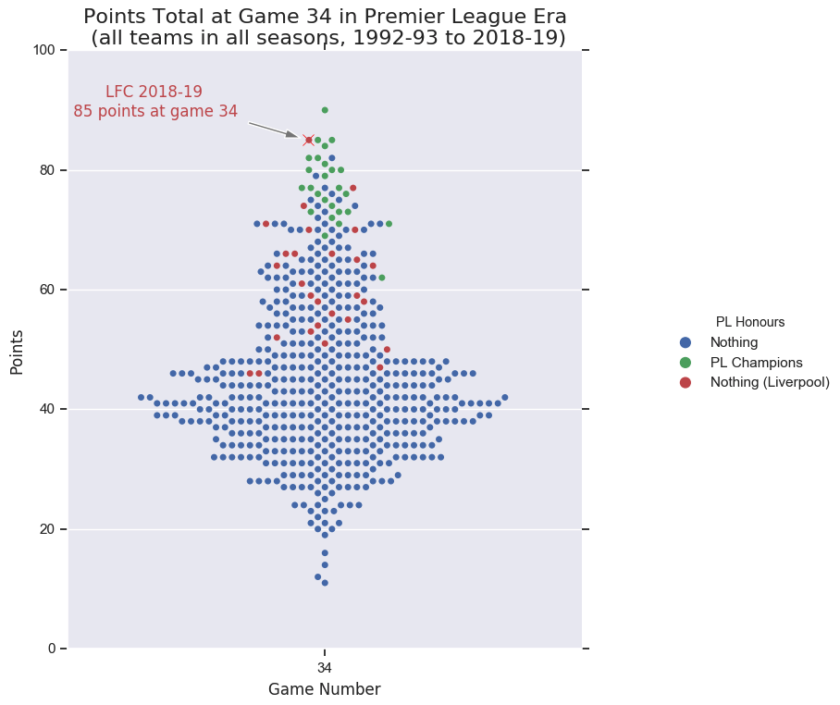
The graph reminds me of a Galaxian (for those into retro computer games) rather than a swarm of bees. The plot also highlights the points totals of the 26 PL champions. As you can see, Liverpool’s 2018-19 points total at game 34 is right at the top, with only Man City’s incredible (financially doped) performance from last season above us. This plot shows just how special this season has been.
Let’s compare Liverpool’s performance at game 34 to those PL champions in their title winning seasons.
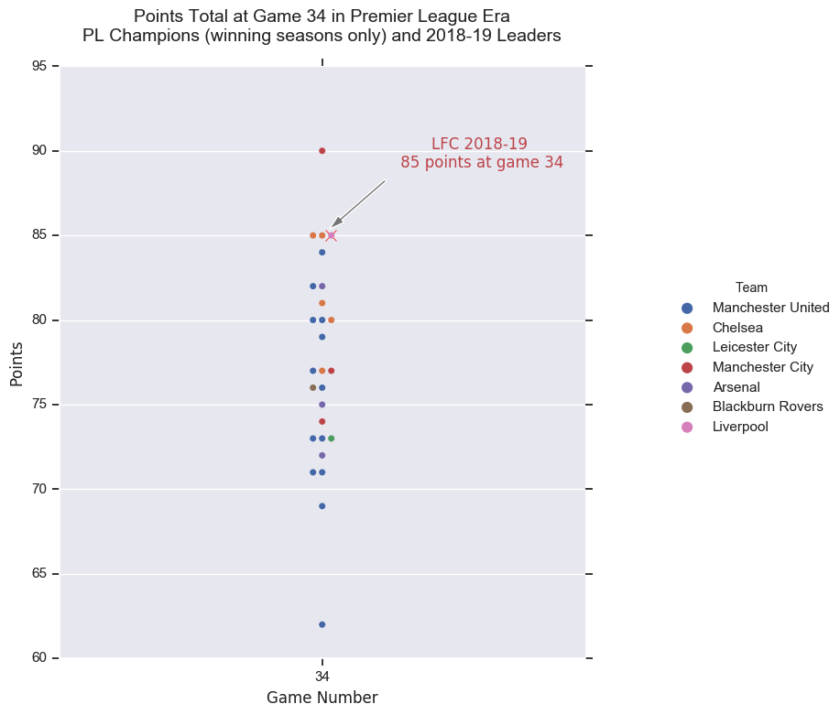
With 85 points at game 34 Liverpool are above all bar 3 previous PL champions, with only 1 Man City season higher and 2 Chelsea seasons tied. Clearly this season would normally be right on target for the league title. Also, it’s incredible to see that Man United had only 63 points at this stage in their title winning season in 1992-93. How times have changed!
Now let’s look at the ‘top 6’ (plus previous PL champions) at game 34 across all of their PL seasons.
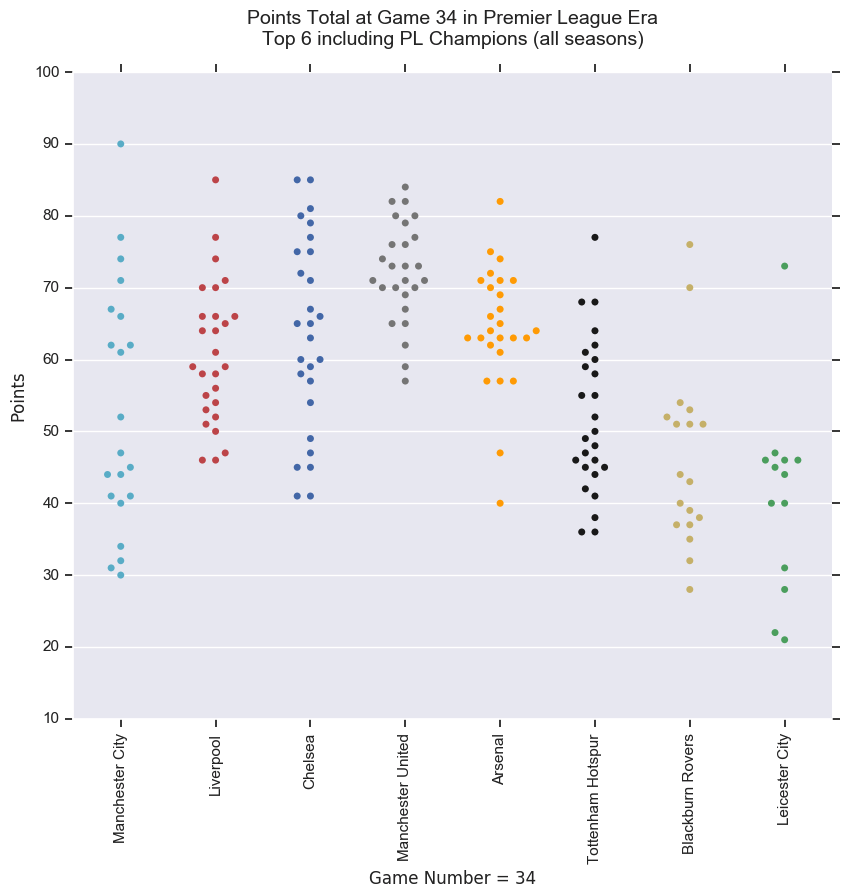
City, Blackburn and Leicester have the biggest spread of points. Perhaps City will go the same way as Blackburn when the funding for plastic flags dries up?
The swarm plot shows that Liverpool are currently (at game 34) ranked second for points in the PL era. Here is a chart showing how Liverpool’s rankings in key criteria (points, goal difference, goals for and goals against) have changed with each game over the season.
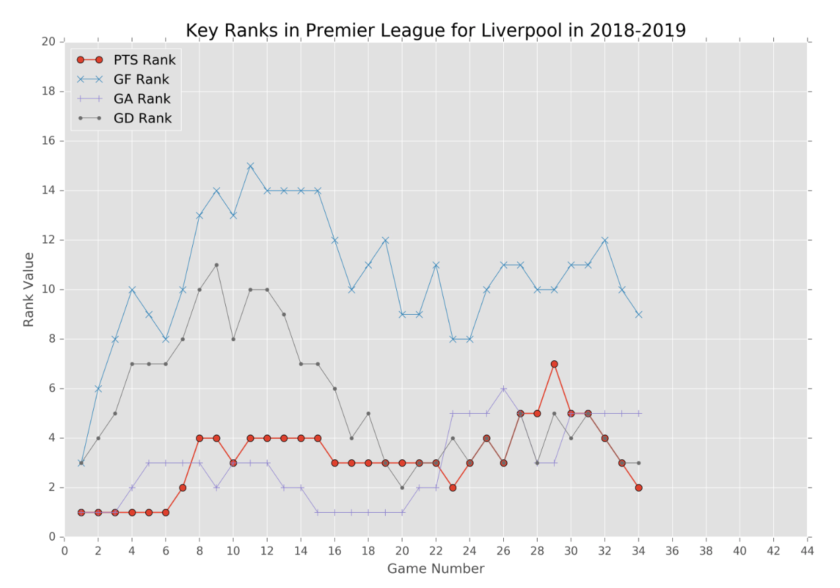
At game 34 this season is ranked second for points (the best is 90 in 2017-18), third for goal difference (the best total is 73 in 2017-18), fifth for goals against (the best is 13 in 2004-05) and ninth for goals for (the best is 98 in 2017-18).
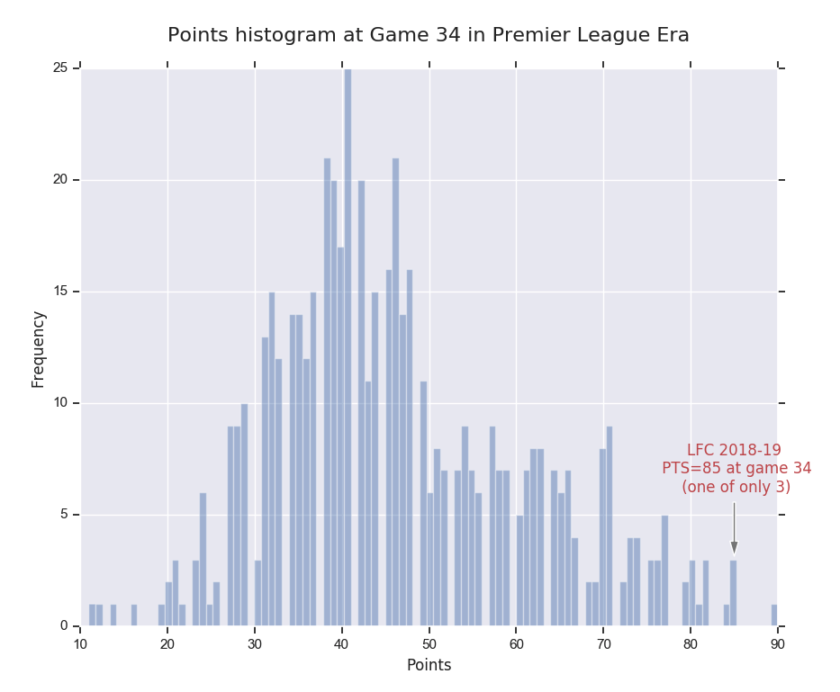
Finally, lets focus on just how impressive our current points tally really is. A total of 85 points after 34 games is at the 99th percentile in the PL era.That is, 99% of all other points PL points totals across all seasons are less than 85 points at game 34. If you prefer that as a graph then here it is.
If we do end up without any silverware this season then, besides the fantastic football, you can take comfort knowing that the underlying numbers prove what we all know – that this is one of the best Liverpool teams that there has ever been, with one of the best managers at the helm, showing season on season improvement. We do indeed live in interesting times!