Episode Five
Following feedback received, this series will mostly not include the dashboards themselves, only screen shots of them. However, links will be provided to all dashboards in the section headings if you want to access their interactive features, if they’re not embedded here already. Clicking on any of the images will open them in a separate tab.
This month’s offering covers the seven match period between Wolves away in the league through to Crystal Palace at home. That’s five league wins and one defeat, plus an FA Cup loss with a heavily rotated side. Who passed to who, what chances were created, did Liverpool deserve the results they had… you should know the drill by now. But I have also made a few amendments and introduced a new chart, just to keep you on your toes.
Expected goals (interactive version)
More games keep getting added to this chart, but the general theme remains consistent: Liverpool usually get what they deserve.
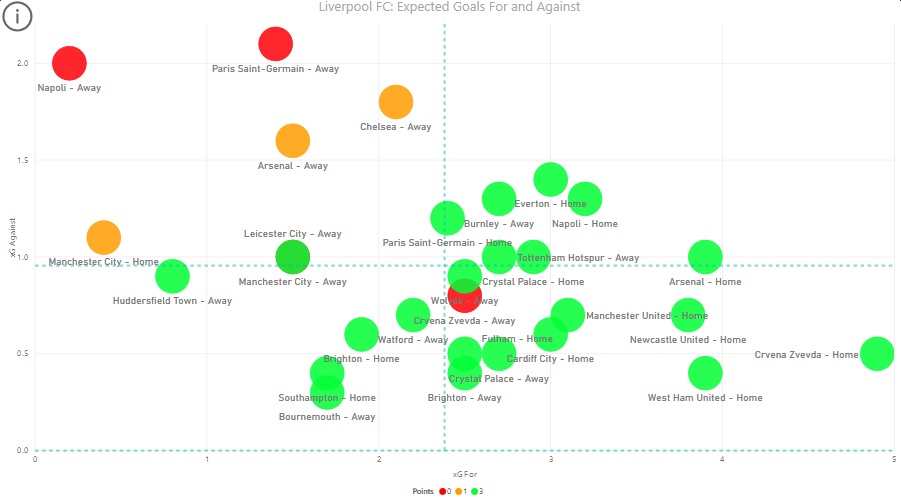
The most interesting addition since the last round up has been the red circle for Liverpool’s defeat at Manchester City, as it’s directly under the green one for Liverpool’s win at Leicester City. Both matches saw the Reds amass an expected goals tally of 1.5 while their opponents mustered 1.0, but one match was won while the other was lost. As I use an arbitrary xG difference of at least 0.6 to denote a win, both games “should” have been draws.
This article is for subscribers only.
[ttt-subscribe-article]