Lately a few people on TTT have been saying that they’ve had discussions with Man City fans who seem to be under the impression that, because Virgil van Dijk cost more than any City player (without taking inflation into account), the two clubs spend pretty equally. Now, this is obviously preposterous and worth addressing, along with the wider spending patterns of the last 25 years – which is something I’ve done now for a decade or so.
So I thought it was worth looking into how much Man City cost in contrast to other champions, and indeed, in contrast to the rest of the Premier League this season. I’ve also looked at specific spending comparisons over the Premier League era – in the form of simple graphs at the very end of this piece; such as Man United vs Chelsea, Chelsea vs Liverpool, Man United vs Man City, Arsenal vs Chelsea, and so on. From it, you can gauge a club’s comparative spending, and see how closely that spending relates to success (or lack thereof).
As some of you may know, in 2010 I co-created the Transfer Price Index (TPI) with Graeme Riley, which was the basis of our book “Pay As You Play”, several articles in the media (see The Telegraph), a talk at a football conference in London in 2015 (which led to Premier League clubs asking to speak with me), and more recently, an academic study co-authored with Hywel Iorwerth, Lecturer in Sociology and Philosophy in the Cardiff School of Sport. Hopefully this is therefore not, as one embittered football journo noted in 2010, “utter bollocks” (without him having read the explanations, I suspect), even if it’s still just a statistical model which doesn’t capture every last nuance.
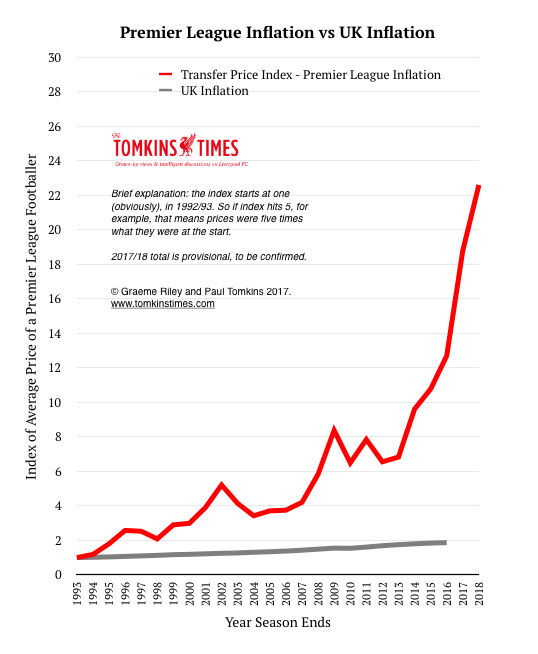
Briefly, for those who don’t know, with TPI we look at every Premier League transfer in any given season, and find the average in order to create an inflation index. So 1992/93 had the starting point of 1 (how indexes work), and then 1993/94 it shifted to 1.19, a rise of 19%.
So if the index reaches 6, that means players in that season cost, on average, six times what they did at the starting point (and we began at the start of the PL era.) Please note that we are now at an index of over 22, which means the average price of a Premier League player is more than 22 times what it was in 1992; whereas if you use the UK’s economic inflation index, it would be just about twice what it was in 1992 – in other words, if football inflation was related to the general economy, you could buy any of the best strikers in England for £6m in 2018; frankly ludicrous! (Note: the latest figure of 22.6 is approximate, and will be confirmed this summer after double-checking; as such, I use “circa” before fees adjusted to 2018 money, as it may be out by a fraction. Also, inflation is closely linked to the rises in TV deals, which is a big part of why it doesn’t follow normal economic inflation)
From all this we came to the concept of the £XI – which was the average cost of the 38 league line-ups for any given club, when adjusted for inflation.
And inflation is vitally important here; it makes a huge difference, not least because we can all see clearly how the market changes from season to season, and no club buys all its players in one season (but clubs do buy in spates; a lot of investment one season may mean less is required in the next two or three. Which is one of the reasons net spend is a poor argument – if you bought a nice house in 2016 you’ll probably have a zero-spend on houses if we covered 2017 and 2018. If you bought ten flash cars in 2015, you can’t then claim to be a pauper because you haven’t bought a car since, but still drive around in the ones you purchased.).
If a club bought half its team just two years ago, then it was buying in a market where players were half the price they are now. So we have to convert them to current day money for the spending to have the correct context within the current team cost. (It can be hard to see the importance, but it’s all about what your money gets you. In 1992, £5m got you an elite world striker. And even as recently as 2011, ‘just’ £50m was the going rate for an elite striker. Now £50m is the going rate for a decent midfielder or an international-standard full-back.)
We found that there’s a strong correlation between £XI and finishing position in the league, and a less-strong correlation between overall squad costs (after inflation) and league position. So it’s not just about the cost of the squad but, more pertinently, the talent that makes it into the team each week. (Which evens out anomalies like your most expensive player being injured all season. You paid a big fee and pay big wages, but it’s not going to help if his leg is in plaster.)
So, for instance, Sergio Aguero cost £38m in 2011. But you and I know you could not easily get a striker of his talent – and fame (he wasn’t under the radar) – in 2017/18 for £38m.
…Okay, so this is roughly what Mo Salah cost! – but of course, Salah was seen as damaged goods after his time at Chelsea, and has doubled an already fairly impressive goal output this season. Had he scored 40 for Roma last season then he would not have been so cheap. And of course, actual transfer values are set by what the selling club is prepared to accept and what the buying club is prepared to pay, and is therefore a little arbitrary. But these calculations are made with the finger to the wind of what’s going on elsewhere, and changes in the market. As I’ve noted over the years, after analysing 3,000 transfers, it’s a split of around 50-50 between successes and failures irrespective of price tag – but if you shop at the top end of the market it only shifts to 60:40 in your favour; the success of a club often lies in bucking this trend – usually only briefly, for a season or two (before they end up with a few duds in the next window) – or buying 10 expensive players to have five successes and being rich enough to jettison the flops.
With inflation Aguero cost City c.£130m, and that makes more sense, doesn’t it? (i.e. not worth as much as the more marketable Neymar, but maybe around the same ballpark as Philippe Coutinho; although you may think Aguero is better.) Of course, Aguero – approaching the age of 30 – wouldn’t be worth £130m on the open market right now, but the fact is, City procured him at a younger age and tied him down by paying £38m in a market where £38 now equals £130m. Age aside, we can comfortably say that he is a £130m player.
(And remember, none of this is changing the perceived “value” of players – they all remain constant, just inflated. So next season Mo Salah will have inflation applied to his fee, but he won’t be a £150m player in TPI because people think he’s worth £150; he’ll be – at a guess – around £47m, depending on how prices change in the next 12 months. All of this analysis roughly evens out the swings and roundabouts of every club having made good buys and bad buys, plus throwing in a few youth graduates, albeit as a decreasing trend. Our analysis leads to roughly the same results as historical wage-bill data, but with our data we can analyse the current season and not wait for wage bills to be belatedly released; and we feel it can be a bit more accurate in some respects, as we focus on the team that makes it onto the pitch. And unlike wage-bill data – which I’m not sure anyone has adjusted for inflation – we can treat all 26 Premier League seasons as equals by converting fees to 2018 money. But as stated, no model is 100% perfect. Anyway, back to the piece…)
Buying several world-class players before this campaign is part of the issue with City – aside from over £200 spent this past season, they already had a lot of expensive players; for example, Eliaquim Mangala cost around £87m in today’s money, making him more expensive than van Dijk; again, think back to how astounded you were in a less-inflated market that City paid £42m (as was) for a defender who then apparently couldn’t defend. By contrast, the c.£95m (TPI) City paid for Kevin de Bruyne (again, people said £55m was a lot at the time) seems like a bargain.
To put everything in context, Rio Ferdinand, at over £154m TPI, remains the most expensive defender in the Premier League era, adjusted for TPI inflation; and second only to Andrei Shevchenko in terms of all signings in English football since 1992. Again, the context explains why. Ferdinand was already an elite defender at the age of 23, and most centre-backs only become reliable in their mid-20s; so there’s a premium for potential improvement and/or potential sell-on value for someone so young. He’d already cost almost £100m TPI when he moved to Leeds less than two years earlier, and coming back to 2018, in the past season three players have moved clubs for an actual £150m or more.
And while £75m for van Dijk may seem cheap in this context, remember he is three years older than Ferdinand was back then. Finally, Ferdinand’s figure is also inflated somewhat due to the financial landscape of 2002/03; for the first time, prices were dropping, after the collapse of ITV Digital in March 2002 led to a decline in the TV money paid by Sky. So most clubs were spending less money; ergo, when Man United spent £30m – a British record – it was at a time when £30m was a hell of a lot of money. (By contrast, when Man City spent £32.5m on Robinho a few years later, teams were often paying fees in that rough ballpark, so his fee in 2018 money is still less than £100m.)
To get back to the current City set-up, a player like Yaya Toure also cost a reasonable amount (£55m), but he does not really appear in the starting XI anymore, and so his figures do not seriously influence the £XI (indeed, nor do Mangala’s). And even with inflation, Vincent Kompany (c.£16m) remains one of the steals of the century.
So, onto the comparisons of spending by the big clubs (and Leicester) over the past 26 years…
(Note: I have been trying to make all TTT articles subscriber-only since December, but I’ve made one or two free, when the need has been there – such as on referees’ apparent bias against foreign players. Due to the demand, this one will not be paywalled, but over 90% of our content has been for subscribers only.)
Relative Spending and Success
In the Premier League era, ten titles have been won by the club with the costliest £XI; occurring almost 40% of the time. People may say that 40% of the titles may have also been won by teams wearing a certain colour or with certain letters in their name, to say that correlation does not imply causation.
So if you then look at clubs whose £XI cost within 92% of the most expensive side (i.e. closely behind the no.1-ranked team on spending), then it rises to 15 titles, or 58%.
Move the parameters to an £XI costing 70% of the most expensive team in the country – so, still relatively expensive in the overall league context – and the number of title winners rises to 22 since 1992, or 85%. Of the remaining four teams, two of them cost two-third the total of the top £XI; meaning that 92% of the titles have been won on a significant budget, if not necessarily the most significant budget. In other words, to win a title you almost certainly have to have spent at least two-thirds of what the most expensive team costs; unless you were Alex Ferguson in 1997, with the £XI reduced by homegrown talent (something that no longer significantly happens with any club), or … Leicester.
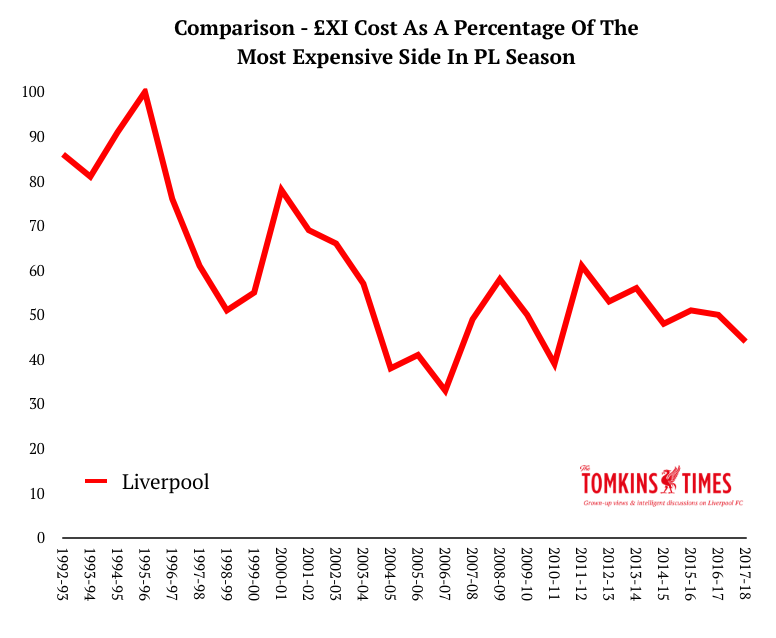
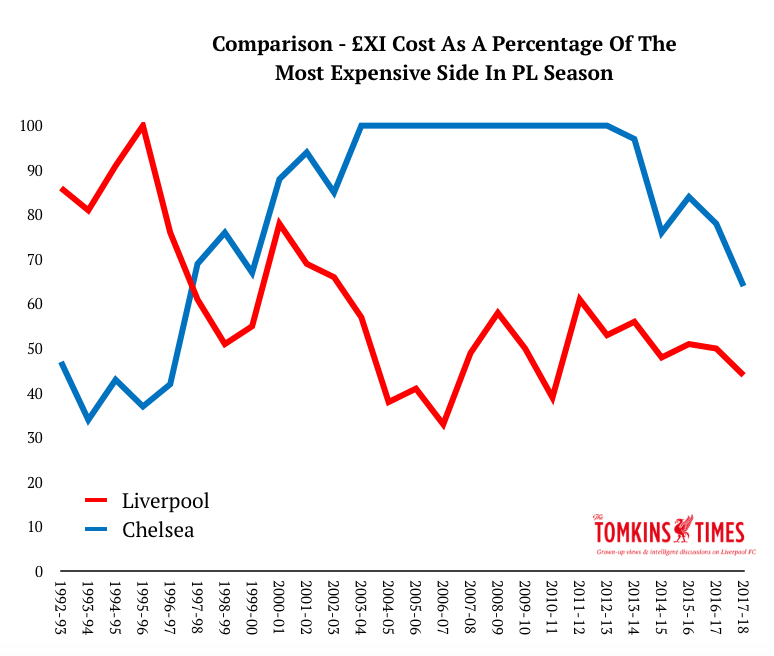
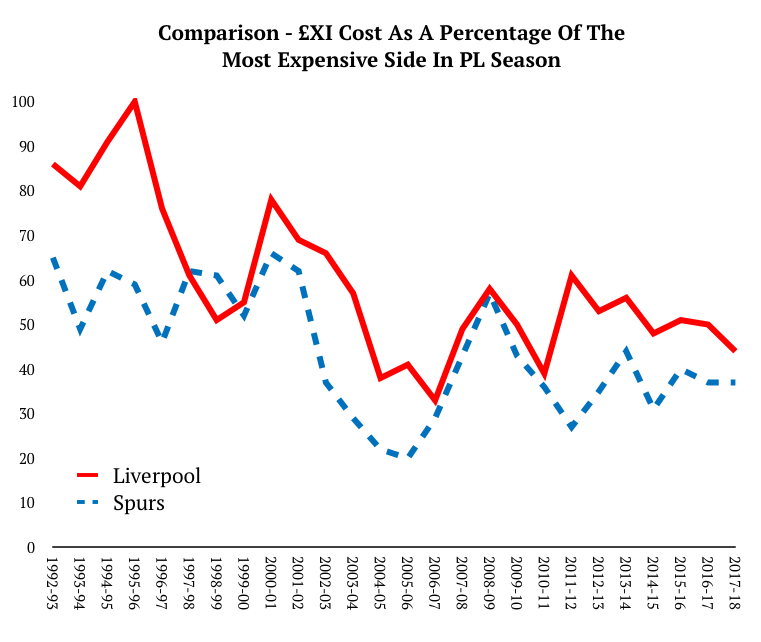
As a brief aside here, Liverpool’s own £XI – in relation to the costliest side in any given season – has averaged at 47.9% since the appointment of Rafa Benítez in 2004, with a spike of 61% in 2011/12, when the Reds underperformed in the league but reached two cup finals, winning one. This season it currently stands at 44%. It had been 100% in 1995-96 – the first and last time during the Premier League era. Since 1996 it peaked at 78%, which was 2001 – when the Reds won a famous cup treble.
While the comparison graphs will follow at the end of the piece, for now here’s Liverpool’s own £XI across the 26 years, relative to the richest team in the country at any given point.
Three of the four outliers from the 26 title winners – costing under 70% of the most expensive £XI – are the aforementioned Man United in 1996/97, at 55% (in no small part due to their ‘Class of 92’); Arsenal’s ‘Invincibles’ in 2004, at 62%; and Man United in 2006/07, at 68%.
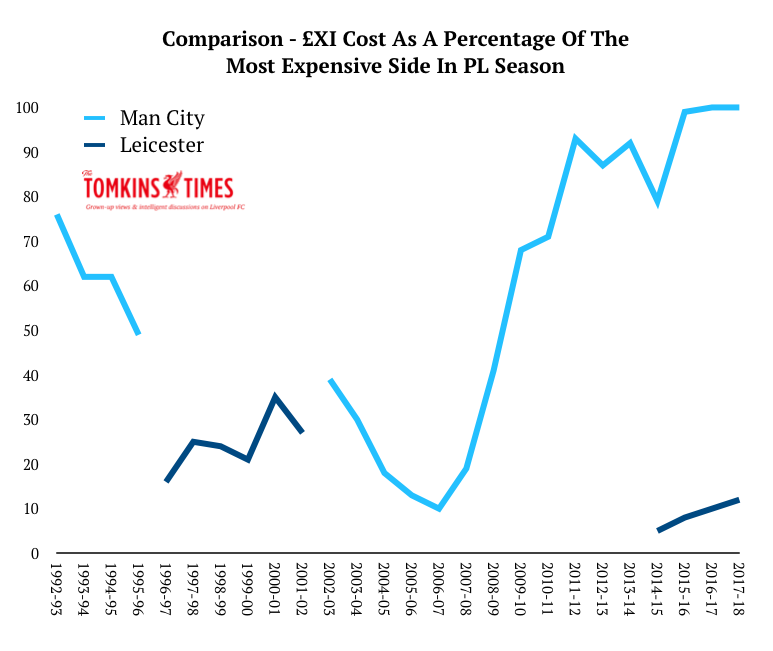
And of course, the headline statistic from it all: Leicester’s title, at just 8%. Eight percent!
While Arsene Wenger did something very special indeed 14 years ago, albeit after six years in the job.
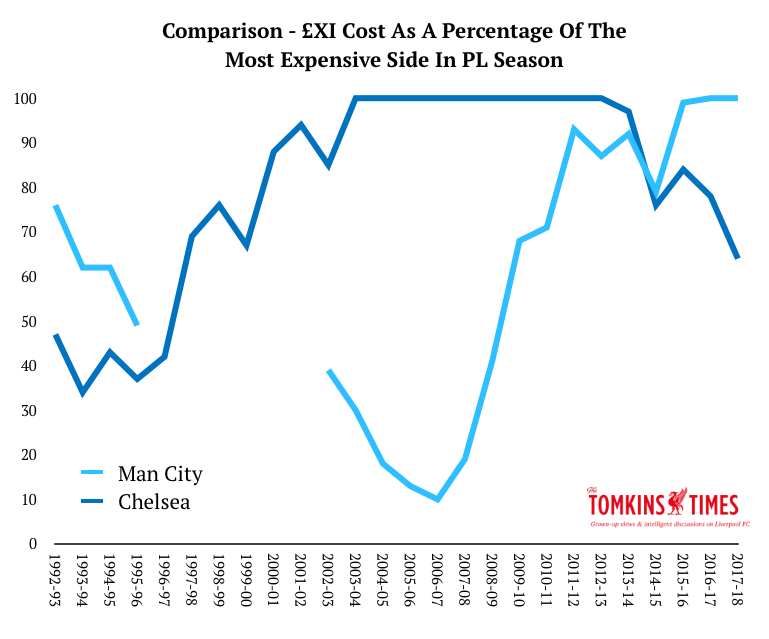
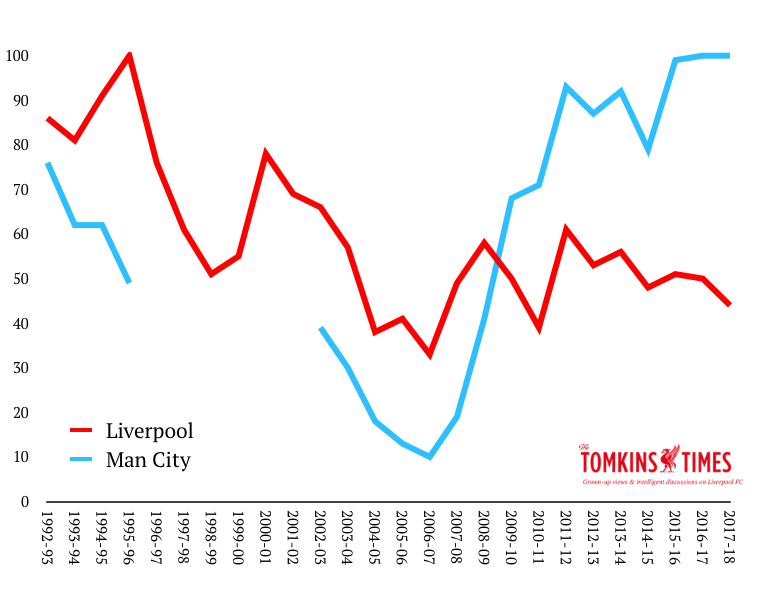
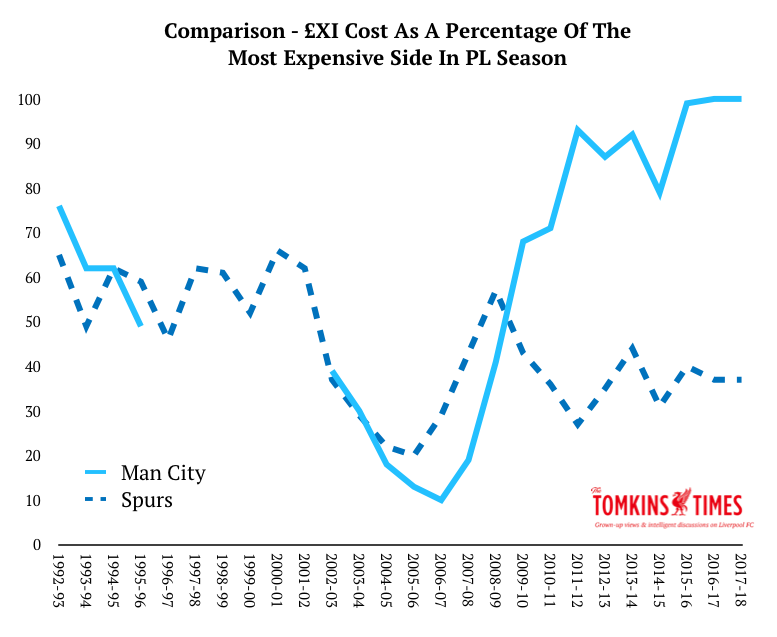
And by contrast, the only two seasons in which Man City have topped the £XI rankings are the two under Pep Guardiola; their investment prior to then seeing them get to within 95% of Chelsea and/or Manchester United, having been at just 10% eleven years ago, before the cash rolled in.
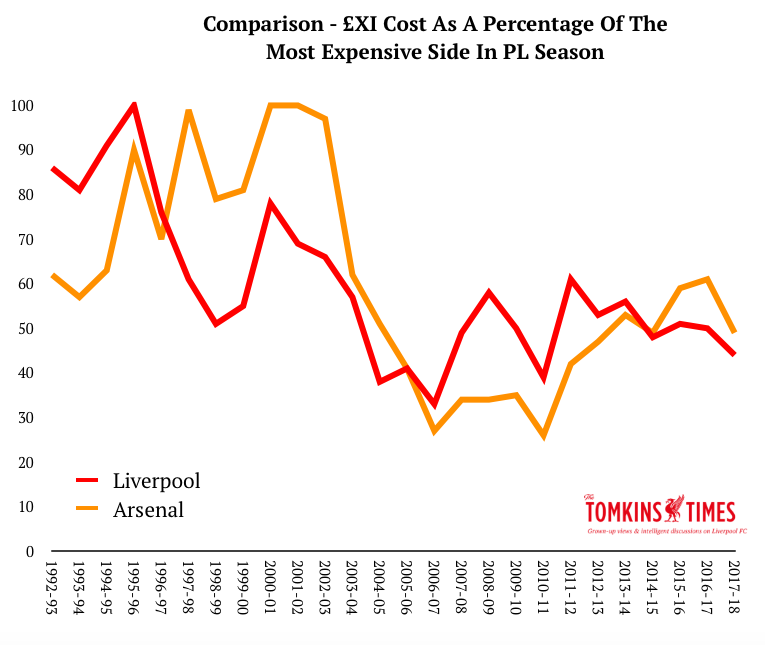
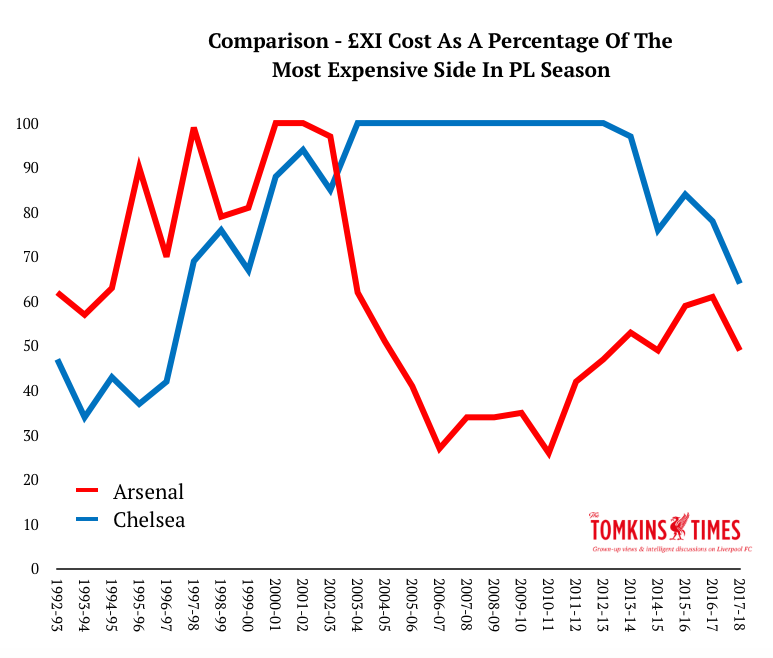
As brilliant as City’s football has been, it has been built on tons of money; although Arsenal’s first title under Wenger was at 99% of the costliest £XI (vs Man United’s in 1997/98) and his second title, in 2001/02, was at 100% – so, the costliest £XI in the Premier League that season. No one thinks of those Arsenal teams as expensive, but while Wenger’s tactics may have become dated, the relative cost of his team has dipped severely since his heyday, hindering his odds of success; with Arsenal’s spending clearly dipping during and after the building of The Emirates, which now stands half empty as a testament to forgotten hopes and dreams.
(Basically, as soon as Roman Abramovic bought Chelsea then everyone else’s £XIs became relatively cheaper, even if they didn’t spend any money in a given season; because Chelsea blew everyone out of the water, and relatively speaking, everyone else’s wealth shrank. Just as, if your house is 50ft tall and is the tallest on the street, it becomes relatively smaller if someone builds a 100ft house next door.)
Manchester United are by far the closest financial challengers to City, at 98% last season and 91% this season; the drop, in part, due to the departure of the massively expensive Wayne Rooney, whose TPI fee started to far outweigh his effectiveness. Klopp’s 44% this season seems much better value for money than either Manchester club, but it may not be remembered for much outside of Anfield unless he lands the Champions League trophy.
And in 2004/05, the 38 league XIs that Benítez fielded ranked at just 38% – around a third of what Jose Mourinho’s Chelsea cost. (I can only assume that the £XIs Rafa fielded in the Champions League en route to Istanbul – if we researched that data – would be very similar, as it was all from the same squad; although this is a comparison against the richest club in England at the time and not, for example, Real Madrid or Barcelona – although even they may have cost less than the Chelsea benchmark.)
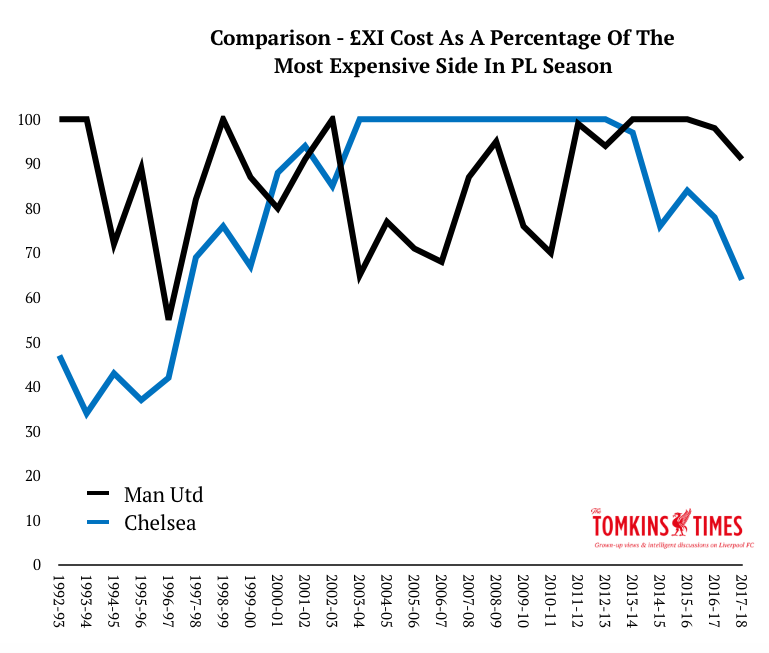
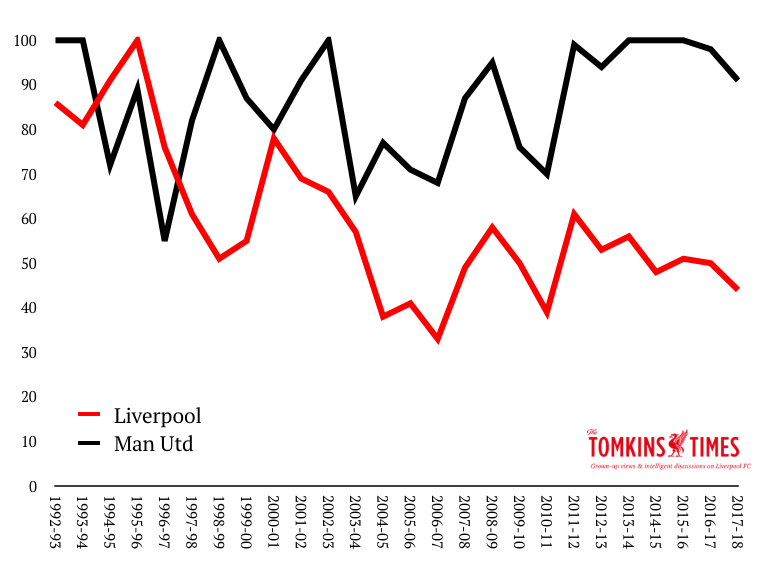
In the last three season’s Chelsea have dropped from 84% to 78% to 64%, having been the 100% marker for a full decade from 2003 to 2013. Manchester United then had three years at #1, usurping Roman Abramovich’s plaything, whilst falling from grace under David Moyes and Louis van Gaal. Manchester City have spent slightly bigger than their cross-city rivals this season, and as noted, United have shifted or demoted some expensive TPI players.
The First Time
Leicester aside, the first title won by clubs in the Premier League era cost, relative to the most expensive £XI of that year: 100% (Man United, 1992); 100% (Blackburn, 1995); 99% (Arsenal, 1998); 100% (Chelsea, 2005); and 93% (Man City, 2012). The only other new champion during this era is Leicester, at the aforementioned scarcely-believable 8%, which I guess is why they were 10,000-1 outsiders. (For a while they shafted the TPI model, but it remains a one-season blip, with normal service restored.)
Aside from Arsenal, who had waited just seven years (and retained much the same defence), the gaps between previous titles was huge: Man United at 26 years, Man City at 44 years, Chelsea at 50 years and Blackburn at 81 years. In order to break their long-held hoodoo they got themselves into the position of the most expensive side in the land (Man United, Blackburn, Chelsea) or damned close to it (Man City), while even Arsenal ending a relatively short seven-year wait was based on being a fraction (1%) off the costliest team in the land. It seems no one (bar Leicester) is able to get that first title in ages without ramping up the spending.
The biggest gap from the club with the costliest £XI to the one ranking 2nd in a season was in 2006-07, when Chelsea were at 100% and Man United just 68%. This was Chelsea at their most dominant financially – so in essence, the most expensive team in English football history – and Liverpool were at a mere 33% of Chelsea’s cost (or basically, the difference between PSG and Monaco in France when based on wage bills).
I argued a lot back then that Rafa Benítez was actually doing a great job on the budget – a mere third of Chelsea’s! – but people seemed to pay no attention to that, and just acted like Liverpool “should be winning the league”.
(It’s odd – and satisfying – to see how Rafa is now getting so much respect for his work at Newcastle, when top four finishes and Champions League finals on a relatively small budget – compared to Man United and Chelsea – was mocked. His Newcastle side currently cost just 11% of Man City’s £XI, whereas in the 1990s – and even as recently as 2000 – Newcastle were the ones on 100%; with 90% in 2001, 99% in 2002 and 94% in 2003, before their own finances nosedived and Abramovic changed the landscape; falling to 72%, then 36% in 2005, and 24% by 2007.)
Indeed, it wasn’t until 2003 that a significant gap started opening between the richest clubs in England; in the 1990s, Arsenal, Man United, Newcastle and Liverpool were all vaguely within touching distance of one another, and even Blackburn’s brief flirtation with big spending only put them a fraction ahead of their rivals in 1995.
For example, in 1996 – the one and only time in the Premier League era when Liverpool topped the £XI rankings – Arsenal’s £XI cost 90% as much, Blackburn’s 98% and Man Utd’s 89%. These are roughly the differences between both Manchester clubs in the past three seasons. Newcastle were at 79% in 1996, and rose to 100% in 1997.
As of now, Liverpool’s £XI is less than half that of City and United, and Everton’s is just over half of Liverpool’s, and Newcastle’s is only half of Everton’s, and Huddersfield’s is less than half Newcastle’s. But there is a kind of economy of scale here – doubling your spending does not reap double the number of points; and the higher up the table you go, the less scope there is break the model.
Remember, Liverpool are currently at 44% of the richest £XI (City), but that figure is rising as the season unfolds due to the recent arrival of van Dijk in January (so the Reds’ team was cheaper for the first 20-or-so league games), and Naby Keita’s figure next season (£48m + inflation) will almost certainly make the Reds’ midfield costlier than it currently is, unless he usurps Jordan Henderson (£55m in today’s money; although I still think he’s been very good value as he approaches 300 games for the club, and is excellent at what he does, if often judged on what he cannot do. Fortunately, Keita can do some of that…).
Liverpool are investing in players, but with the 5th-highest turnover they cannot easily invest as much as the four richer clubs; especially with City’s sponsorship deals tied up in oil money, and Man United benefit most from FFP.
Anyway, before getting onto the comparison charts, I just wanted to make one important point relating to Manchester City and Liverpool and their recent form. I’m not sure if anyone else has noticed (they may well have), but I shall plough on with my observation all the same.
Man City vs Liverpool
Since Liverpool’s 4-1 defeat at Spurs in October, the Reds have played 32 games in the two main competitions (Premier League and Champions League), winning 74 points at 2.31ppg. In that time, Man City have played 31 games and won 71 points, at 2.29ppg. (Taking knockout European games as the same points system: three for a win, one for a draw.) Ergo, as well as beating Man City three times in that period, Liverpool have also edged the blues out in the form guide too.
And 32 games is a big sample; almost an entire league season’s worth of data. (Of these 32 games, only Maribor were below Premier League standard.) Beating City three times does not mean Liverpool are better than them, but the form comparison since October is promising all the same.
As I noted back in the autumn, Liverpool had an extremely difficult start on paper, whereas other teams did not. Liverpool started the season with two additional Champions League qualification games against a top-four German side, but also had Arsenal, Manchester City, Manchester United and Spurs in the first nine games. Indeed, as the table now stands in mid-April, eight of the Reds’ first ten games were against the other nine teams in the top ten.
Also, while arbitrary starting points have their obvious drawbacks (City had a nice lead in the table so they could afford to lose a few games), it’s worth nothing that, in addition to Liverpool’s unusually difficult fixture list before this point (and therefore admittedly slightly easier fixtures thereafter), there was also the Philippe Coutinho saga in the autumn, which can’t have helped, and where City had no equivalent issue; then his eventual protracted departure in January; then Virgil van Dijk’s delayed arrival; plus the (even longer) delayed arrival of Naby Keita, which means a key signing for this season only arrives this coming summer; and indeed, the fact that a now-vital player like Andy Robertson was barely in the team until the winter, and the fact that Alex Oxlade-Chamberlain took time to settle. City have had issues as well (such as a few injuries; although Liverpool have had some, too), but generally their financial might allowed them to seal their desired targets more easily.
I read a while ago that around half of Manchester City’s defensive mistakes leading to goals happened in one league game: the 4-3 at Anfield. But Liverpool then pressurised them into more mistakes at Anfield in the Champions League, and sealed the victory at the Etihad with yet another dreadful error forced from Nicolas Otamendi. As good as City are – and they are the best team I’ve seen in England since Wenger’s peak Arsenal – Liverpool have shown that if you get at them in a ferocious manner they can struggle at the back.
But of course, every team has its weaknesses, and other teams don’t play the way Liverpool play – and you can’t expect everyone else to adapt perfect gegenpressing tactics just for when they play City if they don’t practice it every day. (Everton tried it recently and it went horribly – they pressed from the front with two strikers, but their own defence was terribly deep, so City just lofted passes over the press and played from there. Liverpool’s brilliance in these games was in pressing like a wonderfully orchestrated team. Weirdly, Spurs’ renowned pressing seems to have no effect on City.)
What I will say is that even had Liverpool got van Dijk in the summer and not lost Coutinho (or at least not had the sagas), it would still be hard to see how the Reds would have got the 90+ points that City will end up with. So I think City would be champions regardless, and in case anyone thinks I’m suggesting others, I believe they are totally worthy of the highest praise that has come their way. They have been sensational for most of the season.
And remember, having money does not in and of itself lead to title wins. However, if you have money, invest smartly and have a good manager, success becomes more likely. If you have money, invest smartly and have a great manager, as City do, it helps that bit more.
But even though City will surely invest big again, maybe they’ll have a few more hiccups defending their title – as seems the case a lot recently, with no one mounting a successful title defence in almost a decade.
And Liverpool appear to be getting closer to City’s level all the time, despite playing a greater number of Champions League games with a smaller squad. (Although with the Reds there’s also the weight of history; the almost-crippling desire to land a league title after almost 30 years. The internal pressure when Liverpool lead the table is immense.)
With the Coutinho money, the fortunes from the Champions League run and the general rise in TV income – allied to a bit more income at Anfield with the new Main Stand – Liverpool should also be able to compete better in the market, if not dominate it.
Now, some of that money may go into “invisible” pay-rises for Mo Salah and co., so you can’t just do the transfer-fee in/out maths. And anyway, Jürgen Klopp is not the type to spend money on ready-made superstars (who can cost a fortune and may have attitude issues), so it may not need a £200m splurge to make Liverpool challengers. (And of course, with both van Dijk and Keita we saw that Klopp was prepared to wait to get his ideal targets rather than compromise on those who may be less ideal; he’s a stickler for attitude as well as ability, stamina and pace. In the short-term compromises may have helped, but in the long run it looks hard to complain.)
Indeed, City have improved under Guardiola with the calibre and price of signing (such as Leroy Sané and Ederson) that Liverpool could afford, but City’s advantage has been being able to spend such sums over and over again (and also having a much larger wage bill to support it); and also in having pre-bought, highly-expensive world-class stars like De Bruyne, Aguero and David Silva. Jürgen Klopp inherited no one of that ilk, although has helped elevate Mo Salah and Roberto Firmino into that bracket.
So Jose Mourinho had a bit of a point in talking about the team Guardiola inherited, but United also had a costly squad two years ago, and Mourinho hasn’t significantly improved any of its stellar younger players (such as Marcus Rashford, Luke Shaw and Anthony Martial – Jesse Lingard, age 25, has got better); has relied on his inherited world-class goalkeeper; has added record signings in Paul Pogba and Lukaku who have done “fairly well” at best; and to date, failed to get much out of expensive (for their age) Henrikh Mkhitaryan (now sold) and Alexis Sanchez. A bit like Chelsea before Mourinho arrived first time around, United seem to have a “throw money at it” approach, but not the cohesive vision (even if you didn’t always like the football) the Portuguese gave Chelsea in 2004.
City’s spending is not as extensive as to make United also-rans, but Guardiola has created a great team that’s wonderful to watch and which captures the imagination, while Mourinho struggles to find any style and rhythm with a collection of superstars (but even so, they unconvincingly edge quite a few games with individual talent, and outstanding goalkeeping.)
That said, although he’s clearly a fading force, I wouldn’t write off Mourinho completely, given Man United’s ongoing advantages with Financial Fair Play – which has, in turn, curtailed Chelsea’s runaway spending (forcing them down to two-thirds of the budget of the most expensive side, having been the costliest £XI when FFP was introduced). Managers don’t lose their ability overnight, but their powers can gradually wane, and their successes start to become more intermittent.
Irrespective of any problems the Manchester clubs may have next season (and maybe I’m suggesting that more in hope than anything else), Liverpool could never be favourites anyway. But if things go well, I think the Reds could be closer to City in 2018/19. Remember: as of match-week 30, and using age calculations to the exact day (so not rounding up or down), Liverpool have on average been the youngest side in the Premier League this season, at just 24.3yrs; with Newcastle and Spurs a fraction older, and Man City averaging at 25.1 (and United 25.3).
Indeed, Liverpool’s average age – 24.3 – is younger than Harry Kane, who is (in decimal) 24.8 years old, and yet still eligible for Young Player of the Year.
This doesn’t mean that younger players automatically improve, but it does mean that Liverpool have no potential “melters” in the XI (and only James Milner from the entire first-choice 18), and that a lot of the team – with an average age almost a year younger than City’s – are not even at their peak yet. Money will still play a massive role – as it has in every title bar Leicester’s – but hopefully Klopp can close the gap in the other ways.
Anyway, onto those comparison graphs. I chose to only put two teams on each graph, as it looks like Spaghetti Junction with them all on together. If you’ve read the article, the graphs should be self-explanatory. You can see the investment in teams like Chelsea and Man City rise dramatically, and you can also see the fall-offs from Liverpool and Arsenal, and, in recent seasons, Chelsea themselves.
)