
What do the following 11 players have in common? Jordan Ayew, Ciaran Clark, Ben Foster, Jeff Hendrick, Rob Holding, Roque Mesa, Nacho Monreal, Christopher Schindler, Andrew Surman, Dusan Tadic and Virgil van Dijk. The answer is at the end of the article.
Opta’s defensive errors are a statistic which has been discussed with regards to Liverpool countless times over the years. Between 2012/13 and 2015/16, the Reds made between 29 and 42 every season, and were ranked either third or first every year for most errors in the Premier League. When’s the parade, eh?
Jürgen Klopp has overseen a sizeable improvement in his two full seasons at the club. His side made 21 errors in 2016/17, and with 11 games to go this season the Reds have made just ten. Only six teams have made fewer in 2017/18, and none of those clubs are part of the big six. Liverpool have kept an error clean sheet in 19 of their 27 league games this season; only three relatively low-block sides (West Brom, Burnley and Leicester) have done so more often.
A quick aside, in case this stat is new to you. These errors only include on the ball mistakes which result in the opposition having a shot. If a defender loses his man at a set piece, or passes to an opponent but they don’t have a shot (as two examples) then it won’t be counted here. It’s certainly not a perfect system for assessing defensive mistakes, but it’s the only one which is widely available.
As I watched Wesley Hoedt make a hash of a clearance which allowed Liverpool to take the lead at Southampton, a thought occurred to me: has anyone looked at which teams are most often the attacking side when someone makes a defensive error?
A quick search suggests not, so that will be the focus of this article. Prior to researching the figures, my assumption was teams who like to press (such as Liverpool, Manchester City and Tottenham) would be at the top of the table for most errors provoked (which is the term I’m using, even though some seem to be complete brain-farts by the defenders and require very little provoking by the attacking team whatsoever).
It turns out my theory was correct. The following table shows how many defensive errors each team has provoked and committed, and the difference between the two. They are sorted by their total in the provoked column.
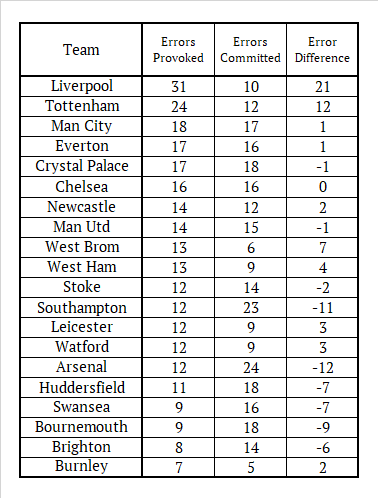 Oh, campeoni… Those figures are simply astonishing. Teams are averaging over one defensive error per match against the whirlwind which is Liverpool’s attack. This should not be underestimated either; 35% of shots resulting from defensive errors are converted into goals, making them almost identical in value to a clear-cut chance (and of course, such shots are often classified as CCCs by Opta). If you can force your opponent into making one of these mistakes, then more often than not a very decent opportunity will present itself.
The rest of this article is for subscribers only.
[ttt-subscribe-article]