
Liverpool just ran in four largely lovely goals against West Ham, and it could have been more. The Reds’ (Oranges’?) defending wasn’t perfect, but even the chaos of Andy Carroll only caused a few flutters, and a couple of bruises to Emre Can’s head.
The goals are flowing. And there are two reasons why I’ve felt this would be the case. First, the fixture list was very tough, but has eased off; and second, the creativity was there, but the finishing – by good finishers – was off, and supposed flops (like Oxlade-Chamberlain) are now adding goals too.
The previous nine games* had seen Liverpool’s “form” – or, actually, the results – change from stagnant to productive. But we can actually see the value of expected goals (xG) as an analysis tool over this period. The tenth, today, further confirmed that this is a team dominating games, with just one really bad day at the office at Wembley the other week. It is a team that can defend systematically, but which makes individual errors. Remove those errors, and things look far more sensible.
(*excluding the League Cup, for which data was not present.)
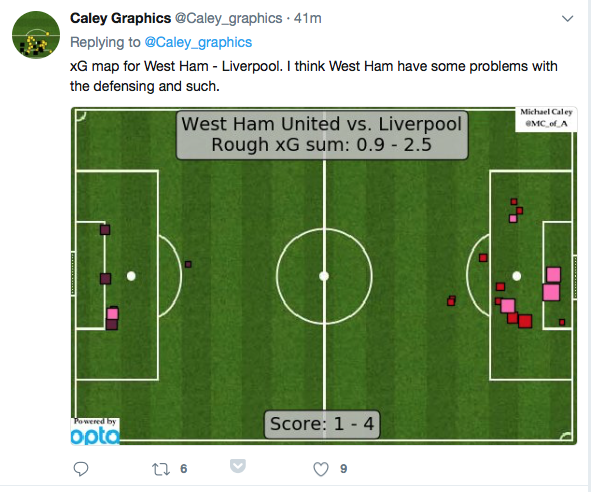
Liverpool’s shot-map today shows a team that is working chances in the box, not just banging the ball from distance. Pot-shots are often a waste of possession, but I’m all for them now and then, to mix things up. The Reds are even scoring set-piece goals, although today it appeared to be from West Ham’s set-pieces. The improved results are simply following the trend of that creativity.
While ten games remains a small sample, it’s far better than one game, where xG can still tell a story (just like the scoreline) but can also be unpredictable. While these aren’t all league games, ten games is over a quarter of a league season. So it’s a decent sample size.
In the five games from Burnley to Manchester United, Liverpool won just once, drawing the other four. But this is where the value of xG comes in. While I’m not an xG expert (an xPert?), I know enough to say that, if you keep winning on xG, the wins will likely follow. I said this back at the time of those draws. (Using Michael Caley’s xG figures.)
It didn’t feel like the usual slump that some teams have, when they aren’t creating anything. But these days, any kind of problem for a team or a player leads to mass hysteria.
Four of those five opponents created between 0.1 and 0.6 xG against the Reds. In other words, add all of their efforts together in each of those games, and the likelihood was they didn’t merit even a single goal. For a variety of reasons, in real terms they averaged a goal per game.
But Liverpool’s expected goals at the other end remained consistent: from 1.6 away at Newcastle to 2.2 away in Moscow, with the other three games ranging in between. Be it away in Russia, Newcastle, Leicester, or at home to Burnley and Man United, the Reds were “worth” two goals a game. But in actuality they averaged just one.
Now, patterns can flip. But logically, if the Reds kept creating two-goals’ worth of chances, and kept it below one goal xG at the back, they should win games. Hence, four wins from the last five, and eighteen goals scored. Corner duly turned.
Indeed, instead of scoring fewer than the xG total, as was the case back then, the Reds are now scoring more. From famine to feast. The last five games have seen the Reds being more ruthless than the expected return from the chances that came their way. So maybe they’re running a little hot right now. But that’s a nice change, and even then, it still only evens it out and regresses to the mean.
The second half of this article is for subscribers only.
[ttt-subscribe-article]