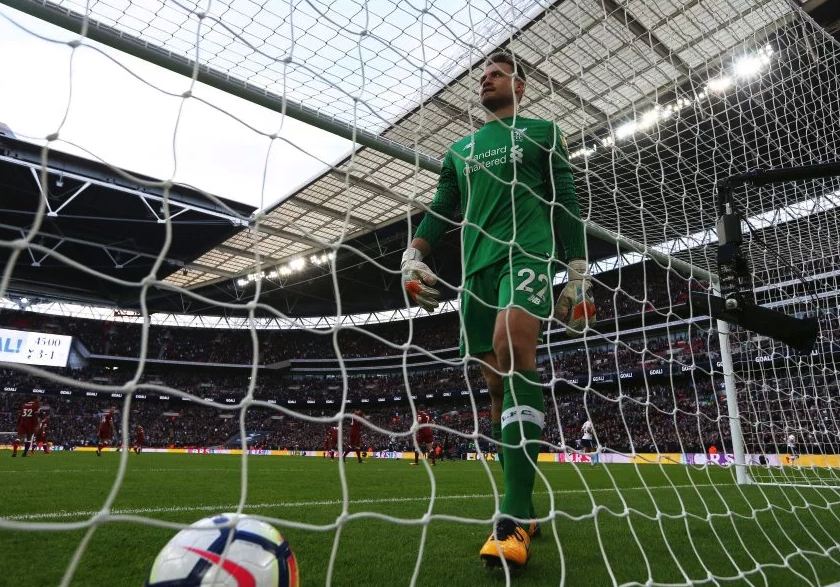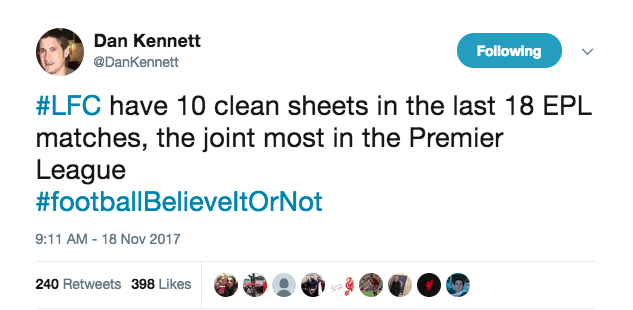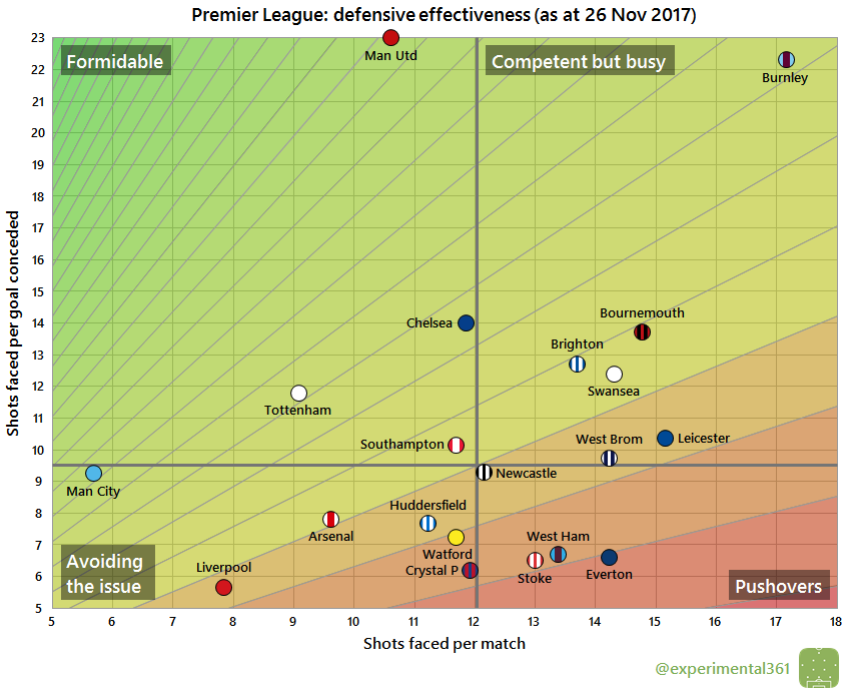
We are the Clean Sheet Kings! The cleanest sheets in the whole league … if you ignore the other eight games when we conceded about 84 goals.
What about defensive errors? Surely we are top of that particular league? Well, here are the figures compared to our rivals.
Total Errors (Errors that led to a goal)
Arsenal – 10 (4)
Manchester United – 6 (2)
Manchester City – 5 (2)
Liverpool – 5 (2)
Tottenham – 5 (1)
Chelsea – 5 (0)
Well that can’t be right, can it? Arsenal are basically the biggest defensive sponge, porous from all angles, handing goals on a plate, wrapped in Wenger-print wrapping paper. Mourinho? Absolute joke of a defence, even when parking buses all over the place they still make more errors than the Reds. That Guardiola chap couldn’t prevent defensive errors if he’d been coached by Maldini and Sacchi. The Poch is the biggest fraud since Rodgers and if he doesn’t hire a defensive coach then he’ll be gone by the end of the year.
Or, the whole metric itself is flawed – and despite having value when used with emphasis on the fact it is only on-the-ball (and many don’t) – it misleads more than offers insight. And this is something I’ve been thinking about for over five years (which has to be unhealthy!). Especially when people then take the stats and use it to ‘prove’ Liverpool’s defence isn’t that bad really, and is comparable to the teams around them
My biggest gripe is that most defending is done off-the-ball. Team shape, synergy and military-like organisation where each individual component knows their role and executes it with missile-precision, preventing a last ditch tackle from ever having to be made. Making sure the aerial duels are predominantly ten yards outside the edge of the penalty area. Or the flip side, parking the bus, encouraging teams to cross to the four centre-backs positioned to deal with such a tactic. It’s all about a unit rather than the individual. And yet, can we still come up with a better tool than the OPTA on-ball only defensive errors metric? Is it possible to come up with an Error Rating, or ER for short, as many of us end up in the emergency room after watching us defend a three goal lead in Spain or basically any corner.
I’m not entirely sure how this will work either. In fact, it is going to require a fair chunk of effort and commitment on your part. Not only that, but you’ll have to watch all of the goals we’ve conceded this season, and assign a rating to the player you deem worthy of any blame. For ease of use, for every one goal conceded there’s the potential for 100% blame. You might only think one player deserves 50% and the rest was skill or composure from the opposition attacker. The choice is yours. The table is ready for your input, and is free for anything to use. The more the better! Below, there’s a variety of tools used to measure of judge the effectiveness of a team. This is only for context, and shouldn’t really influence any of the ratings. The video of all the goals conceded is for subscriber only.
For example: For the opening goal we conceded against Watford this season, my rating was:
Firmino 30%
Matip 30%
Mignolet 30%
Can 10%
As you’ll have noticed, these figures are just about as subjective as it gets. That’s why I don’t trust them for analysis. However, if I can even get another ten people to take part in rating the errors, then I’ll be able to a few things:
- See the range of opinions. If the range for each goal is so vast and different between those taking part then we can see the difficulty in applying objective analysis to a lot of defensive issues. And how complex it is to gain any consensus.
- Find out if there’s any agreement, and if the ratings at the end reflect the ‘eye test’ as well as the data test.
- Build on it as the season progresses. And understand the variety of different errors participants pick up on.
Defensive Context in the Premier League
The rest of this article is for subscribers only.
[ttt-subscribe-article]

