After the ninth league game of last season, TTT subscriber Tim O’Brien shared his adaptation of an American sports’ ranking system that focuses on the different quality of opposition faced, to determine how well the Reds were doing exactly one-quarter of the way in. As we’re at the same stage this season, he sent me all the rankings from this season, which I will share here, with my own analysis, along with his original explanation of how it’s all calculated and last season’s rankings at this juncture.
Later in the piece, in Part Two, I will share the excellent analysis of another subscriber – LFC historian Terry Dolan – who posted on the site last night about the unusual difficulty of the fixtures this season, and in particular, an example of where something similar happened, and how things were turned around. I thought that was worth sharing too. Both Tim and Terry were posting in reply to my recent pieces which noted how bizarre this season has been for the Reds in terms of the fixtures.
First, to Tim’s Ratings Percentage Index (RPI).
It’s worth noting that this is just the league games. As I wrote very recently, this has been Liverpool’s toughest start to a season across all competitions for at least 25-30 years. (See this article for all the details.)
Liverpool have never played so many top four English, Spanish and German sides, and last season’s Champions League quarter-finalists, by the same stage of a season. (And the same applies if including Italian teams in previous seasons too, as the fourth of the big four European leagues.) My theory for some of the Reds’ struggles this season has not just been playing the extra games that the Champions League brings, but the difficulty of the first three fixtures in particular (two of which were in the qualifying round, meaning two additional games), plus the bruising League Cup tie at recent champions Leicester. The first really easy fixture the Reds have had this season was Maribor away.
Anyway, below is the RPI table (not to be confused with our Transfer Price Index, or TPI, which ranks teams based on expenditure. Also, any mention of RPI does not relate to the Retail Price Index!).
The explanation as to how RPI was calculated follows further down this article.
| 2017-18 |
% of PTS |
RPI |
| Man City |
92.6% |
53.9% |
| Liverpool |
48.1% |
50.5% |
| Chelsea |
59.3% |
50.3% |
| Tottenham |
74.1% |
50.2% |
| Watford |
55.6% |
49.1% |
| Burnley |
48.1% |
47.6% |
| Everton |
29.6% |
46.9% |
| Arsenal |
59.3% |
46.8% |
| Man United |
74.1% |
46.8% |
| Stoke |
29.6% |
44.9% |
| Brighton |
40.7% |
44.7% |
| Newcastle |
51.9% |
44.3% |
| Huddersfield |
44.4% |
44.2% |
| Bournemouth |
25.9% |
43.6% |
| Leicester |
33.3% |
43.2% |
| West Ham |
29.6% |
43.0% |
| Southampton |
44.4% |
42.7% |
| Swansea |
29.6% |
42.1% |
| Crystal Palace |
11.1% |
42.1% |
| West Brom |
37.0% |
41.6% |
For all the (hopefully) interesting points I will come onto, this is not an accurate proxy of a league table; it doesn’t say that this is what the table should be based on merit. And like all models, it’s not perfect.
Also, the spread is not as extreme as the league table; the gap between top (53.9%) and bottom (41.6%) is fairly shallow, compared with the 25 –> 3 divide in the actual table. It does, however, still show Manchester City as the best team in the Premier League, and Crystal Palace as almost the worst. Last season at the same stage, the spread was 54.1%, for Liverpool at the top, down to 35.9% for Sunderland.)
What RPI does do is allow – and weight – for the difficulty of games. The teams at the top of the actual table are punished in the RPI table if they played a lot of games against struggling sides. Manchester United’s ludicrously easy start (on paper) works against them, even if, bar Huddersfield, they’ve taken most of the points in those winnable fixtures.
And of course, you can’t blame United for beating most of the teams put in front of them. But they’ve dropped 25% of all points, and arguably only played one good team (Liverpool, and the Reds weren’t even in form). Of course, even the best teams will drop points occasionally against the worst teams – an easy fixture list never means 100% of the points. But it puts United’s performance into context. They’re doing pretty well, but against poor opposition.
While Liverpool haven’t racked up a ton of points this season, the opposition’s quality and form is what places the Reds so high in this table. (And remember, the RPI wasn’t invented to make Liverpool look good!) It suggests that the league table at this point is, in some way, deceitful; it may tell the truth after 38 games, but a sample of nine unnaturally tough games is not representative. RPI does not, however, analyse the balance of play or what the table would look like based on chances created and that type of metric.
Even Man City haven’t had a particularly tough start, but they have at least played, and beaten, Liverpool and Chelsea. Their other games were Brighton, Everton, Bournemouth, Watford, Crystal Palace, Stoke, Burnley, most of whom have struggled this season. But City have done so well that they still top the RPI table, due to picking up 92.6% of the available points. It’s just 92.6% of points against mostly beatable sides, but boosted by the two key wins against top four rivals.
Last season’s champions, Chelsea, were 4th in the Premier League at this stage of 2016/17, but 2nd in the RPI. That would suggest that they’d had a fairly tough start on paper, which makes sense, with their defeats to Liverpool and Arsenal included in that underwhelming initial period.
This season, and one of the reasons I’m pleading for patience is that, on top of having three games against top four Spanish and German opposition, Liverpool, with four head-to-heads, have played at least twice as many “Big Six” fixtures as the other five members, bar Chelsea (who have played three). Let that sink in. And while Liverpool had done well in these types of fixtures under Jürgen Klopp, it was never with Champions League games at the same time.
Chelsea are also seen to be struggling this season, but again, it’s been a tougher than average start. By contrast, Man United’s one head-to-head seems bizarre, but they play Spurs and Chelsea next, then Arsenal at the start of December. (By then, Liverpool will have also played Chelsea, so United won’t catch up there.)
Big Six Head-To-Heads So Far
4 Liverpool
3 Chelsea
2 Arsenal
2 Man City
2 Tottenham
1 Man United
Anyway, before I get onto how useful RPI could be as a predictive tool, here’s the explanation as to how it was calculated.
Ratings Percentage Index (RPI)
Here’s what Tim said last October:
…I have been thinking about a way to quantify the strength of our start, and I attempted to do so using something from American sports called the Ratings Percentage Index (RPI).
In basketball at the University level in the U.S. there are 351 teams who play in Division 1, the highest level. These teams play roughly 30 games per season (it is not a set amount) against varying levels of competition. As a result, there can be vast differences in the quality of two teams who both had 17 wins and 13 losses.
There is a committee tasked with deciding which 68 teams are given entry to the tournament at the end of the season to determine the champions. This tournament is probably the closest thing we have in the States to the FA Cup. This committee uses the RPI as one tool to help them make their decisions. It is not perfect by any means, but by and large it does a good job of defining the true quality of the various teams. A given team is usually within a few places of where a poll of coaches ranks them.
The formula for the RPI is simple. It assigns a 25% weight to the team’s winning percentage, a 50% weight to the average of all of that team’s opponents’ winning percentages, and a 25% weight to that team’s opponents opponents’ winning percentage.
I made a slight adjustment as, unlike football, there are no draws in basketball. Instead of using winning percentage, I used % of points gained versus those available. For example (remember, this explanation was written a year ago), Liverpool have gained 20 out of a possible 27 for 74.1%. I could not think of a way to weight home and away matches, so I ignored that factor.
Prediction
All kinds of things can happen in the remainder of a season. Teams lose form and others find form. Places shift. Teams get injuries; others spend big in January or change their managers. There is no crystal ball; you can assess probabilities, but fate will often intervene.
However, using Tim’s system, I thought it was worth comparing the positions of teams in both the RPI from twelve months ago, and the league table from the same time (after game nine: PL9), against the final league positions. What was closer to the eventual truth? The league table after a quarter of a season or the RPI table from the same time?
Well, there’s a fairly big difference. The final league table had eight clubs within two places of where they were in PL9; so eight teams stayed roughly where they were at a quarter of the season in. However, the RPI had ten, so it was 25% more accurate.
More tellingly, the final league table had eleven clubs within three places of where they were in PL9, but a whopping seventeen of the RPI table were within three places. Ergo, last season, after game nine, you were better off trusting the RPI table than the league table in terms of what would later transpire. Only three clubs ended up more than three league positions away from where they sat in the quarter-season RPI.
I don’t know if this is a regular occurrence, nor do I know how statistically significant it is. However, it’s an interesting finding.
Of course, by PL9 last season the top six was the Big Six. This season the top five is the other members of the Big Six, bar Liverpool. But as we will come onto later, Liverpool had a similar start to a season under a world-class manager, and were struggling up to PL9, before turning it round.
Other Clubs
With some sackings having already taken place, I thought it was worth looking at how much fixture difficulty played a part in those discussions.
Like Liverpool, Everton have had a bitch of a start. Everton’s has possibly been slightly tougher in the Premier League, in that they’ve played five of the Big Six, to Liverpool’s four; although Everton have played more teams currently in the bottom half (Bournemouth and Stoke). Both Merseyside clubs have played Burnley, a difficult if unspectacular opponent. But both clubs have also been thrown back into the European arena, and this appears to be getting increasingly difficult to handle, perhaps why the past two Premier League champions haven’t even been in Europe.
Unlike Everton, Liverpool have played three really tough European games, if we are not very generous to Klopp and co. and write off a trip to the Russian champions as no longer a super-tough game (and the Reds were unlucky not to have won).
Everton are obviously playing Europa League standard football. So it’s not going to be as good as the standard Liverpool are involved with. But Atalanta and Lyon are good sides from big leagues, and obviously Everton are not as strong as Liverpool, who might be expected to beat those sides. Everton also had the four extra qualifying games, whereas Liverpool had two. I think the Merseyside clubs have played the greatest number of fixtures so far.
Everton, like Liverpool, are getting all their tough fixtures early in the season, when both teams are in Europe in the same week; which the Premier League calendar seems to favour. Ronald Koeman was also integrating a lot of new players at once – which is tough (and a reason I wasn’t too alarmed that Liverpool didn’t sign a ton of players this summer), and so I have some sympathy for Koeman, who’s points-per-game was more or less the same at the club as the “revered” David Moyes. There football did look slow and dull, but did Koeman sell Romelu Lukaku and sign the new buys? Wasn’t ex-Leicester scout Steve Walsh doing that job? It seems to me that the Dutchman suffered the familiar struggle to build a team quickly with the new money, at the same time as being given a tough start (and European football), and with expectations haven risen. Once expectations rise, fans are quicker to turn. But the fixture list was clearly unkind.
Crystal Palace are slightly different to Everton. They played four of the Big Six in the first eight games, but the other five fixtures could be classed as “winnable”: Huddersfield, Swansea, Burnley (all under Frank de Boer), Southampton and Newcastle (under Hodgson). These are all teams that would expect to be vying for mid-table along with Palace; two promoted sides and three mid-tier Premier League sides. Burnley are, of course, hard to beat, but they seem to raise their game for the big matches and get caught out by the smaller teams who now see them as something of a scalp. I wouldn’t expect Palace to beat Burnley, but if they’re losing a lot of other games, they have to pick up points somewhere. In these five games, they’ve lost five, and scored zero.
The Impact
Prior to visiting Spurs, Liverpool had not been playing badly. And at times, not even defending badly. The first 20 minutes at Wembley was grim, although as I noted in this piece for subscribers, Dejan Lovren has been on painkillers, and Daniel Agger recently admitted to being too spaced out to even remember games he played in. Of course, Agger declined rapidly towards the end of his time at Liverpool, as injuries took their toll at an age when he should have been in him pomp; and Lovren is, of course, more prone to errors anyway.
As with Jordan Henderson and Emre Can getting grief last season when hampered by persistent problems, it’s worth remembering that players are often “being brave” by playing through pain and dosed up on steroid injections, and all they end up getting is abuse for doing so. They are trying to do the club and the manager a favour; sometimes it works, sometimes it goes horribly wrong.
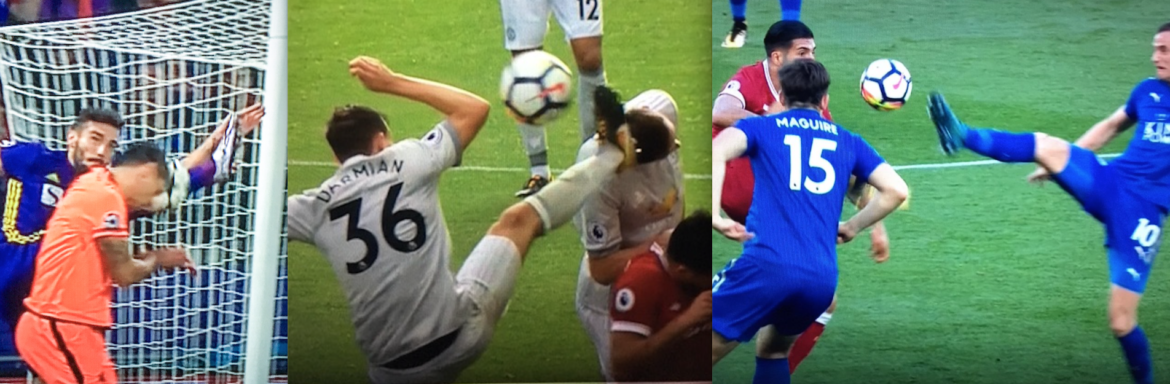
Before moving onto Terry’s unique look at the fixtures, there’s the infamous red card at Man City, of course, which probably cost Liverpool two or three points across the 3.6 games Sadio Mané missed. On that, I’ll just share the triptych at the start of this article, for high boots against Liverpool since that sending off. None of them were seriously penalised; one was a yellow card, one was a free-kick, and the other wasn’t even a free-kick. (This may be clutching at straws, but it feels good for my sanity to share it. The more time that passes, the crazier – and costlier – it seems; not least as Mané looked tentative afterwards, as if scared of going into challenges in case he hurt someone and got sent off, and lost his playing rhythm. Losing Mané to injury is less galling, although again, that was not down to Liverpool but Senegal.)
Liverpool had a tough start to last season too: lots of away games, and a fair few tough games. But no European games in amongst it all. That was probably what helped keep up the impressive form. There also hadn’t been the overshadowing saga of Philippe Coutinho trying to leave, which can’t have helped, particularly on the eve of the opening day. But the problem is one of a negative spiral: once you get dragged down the table, the mood changes in the ground, and everyone is more anxious. So hopefully people will read and share this, and understand that, actually, it’s been a far tougher than normal start, and that, Spurs aside, Liverpool had generally been playing well but missing chances.
Part Two, by Terry Dolan
Paul’s very good article got me thinking about tough starts to the season. As a distraction from the pain of Wembley I’ve had a go at automatically identifying these tough starts. By my calculation (and this is not definitive as there are many ways of measuring quality of opposition) 2017-18 is the third most difficult start in the Premier League era. Klopp’s rotation policy is probably a direct response to this very difficult start. What he couldn’t see coming was a run of extreme bad luck and kamikaze defending. We now need to see a positive response from the whole squad.
There are only 3 seasons in Liverpool’s history in which we have faced 6 away games in 7 consecutive fixtures in the first 15 games in the top division.
| Season | First 15 games |
| 2006-2007 | HAAAHAAAHHHAHAA |
| 2016-2017 | AAAAHAAHAHHHAHA |
| 2017-2018 | AAHHHAHHAAAAHAA |
For the seasons in the Premier League era, I selected all of Liverpool’s games in all competitions up to and including league game nine, summed the elo rating (as of 1st August in that season) for each opposition team and then divided the total by the number of games selected to give a measure of the quality of the opposition for that season – the opposition elo per game.
Here are the top 5 seasons, sorted by Opp_elo_pg:
| Season | Opp_elo_pg | Tot Games | LFC_elo |
| 2008-2009 | 1730.642049 | 15 | 1958.287354 |
| 2006-2007 | 1726.932153 | 15 | 1861.145508 |
| 2017-2018 | 1722.299731 | 15 | 1834.657349 |
| 2007-2008 | 1710.120998 | 14 | 1878.843628 |
| 2014-2015 | 1701.052753 | 13 | 1894.936646 |
Game data: LFChistory.net; Elo data: clubelo.com
I also tried weighting the elo rating, giving a 10% addition to the opposition elo for away games but it didn’t change the position of this season.
Here is the list of games for 2008-09, the most difficult season, with the opposition elo ratings:
| Game# | Date | Opposition | Venue | Competition | Result | Opp_elo |
| 1 | 13/08/2008 | Standard Liege | A | Champions League 3rd Qualifying round 1st leg | D | 1608.805664 |
| 2 | 16/08/2008 | Sunderland | A | Premier League | W | 1666.809448 |
| 3 | 23/08/2008 | Middlesbrough | H | Premier League | W | 1731.135986 |
| 4 | 27/08/2008 | Standard Liege | H | Champions League 3rd Qualifying round 2nd leg | W | 1608.805664 |
| 5 | 31/08/2008 | Aston Villa | A | Premier League | D | 1797.87146 |
| 6 | 13/09/2008 | Manchester United | H | Premier League | W | 2025.484009 |
| 7 | 16/09/2008 | Marseille | A | Champions League First Group Phase | W | 1712.538818 |
| 8 | 20/09/2008 | Stoke City | H | Premier League | D | 1604.997437 |
| 9 | 23/09/2008 | Crewe Alexandra | H | League Cup 3rd round | W | 1432.8396 |
| 10 | 27/09/2008 | Everton | A | Premier League | W | 1846.777222 |
| 11 | 01/10/2008 | PSV Eindhoven | H | Champions League First Group Phase | W | 1682.435913 |
| 12 | 05/10/2008 | Manchester City | A | Premier League | W | 1718.141357 |
| 13 | 18/10/2008 | Wigan Athletic | H | Premier League | W | 1689.499268 |
| 14 | 22/10/2008 | Atletico Madrid | A | Champions League First Group Phase | D | 1818.806396 |
| 15 | 26/10/2008 | Chelsea | A | Premier League | W | 2014.682495 |
It was the best of times, it was the worst of times, it was the age of wisdom, it was the age of foolishness, it was the epoch of belief, it was the epoch of incredulity, it was the season of light, it was the season of darkness, it was the spring of hope, it was the winter of despair.
A tough start to a season should temper expectations. But it doesn’t work like that. Disappointing results are most frustrating when the Liverpool team is very good and capable of so much more. The truth is, as many of the great Liverpool sides have shown, it’s not how you start that matters but how you finish. And the good thing about a tough start is that it is a great platform to push on.
In 2006-07 Liverpool had 11 points after the 9th league game and were in 11th position, eventually finishing 3rd. 2006-07 was the start of a challenging run for Rafa, with 3 consecutive seasons in the top 5 most difficult in the Premier League era.
In 2008-09 Liverpool had 23 points after the 9th league game and were in 1st position, eventually finishing 2nd by 4 points.
In 2017-18 Liverpool currently have 13 points after the 9th league game and are in 9th position. Like Rafa, hopefully Klopp can use this difficult start as a platform for a very good finish to the season.
)