By Paul Tomkins.
So, how do Premier League managers perform against expectations?
PART ONE
League Form
While this is a Liverpool FC website, this piece has something for the fans of most Premier League clubs. There is still a slightly greater emphasis on Liverpool, but it’s an unbiased assessment of performance over the past dozen years.
Over the last five years we’ve* shown how strongly spending correlates with final league position, with our measure being the £XI – the average cost of the XI over 38 league games, with inflation applied. (*By we I mean the Transfer Price Index, which I co-created with Graeme Riley.)
To quickly illustrate the point before going onto the crux of what I have to say, this is a graphic by my TPI co-author, Graeme Riley, that shows the correlation between £XI rank and finishing position since 2003 (and I’ll go on to explain why that year was chosen):
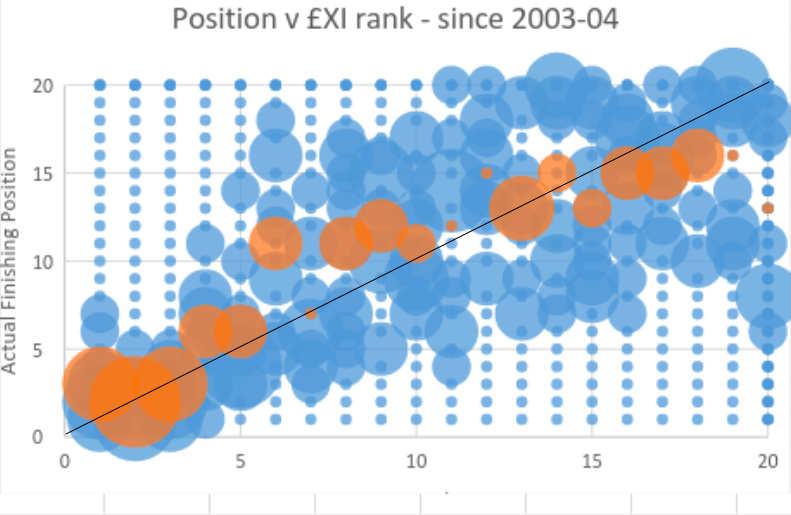
Clearly, average league position over that time (1-20, vertical) closely correlates to £XI rank (1-20, horizontal). I would just like to point out here for those of a challenged intellect (i.e. a few people who message me on Twitter) that this doesn’t automatically mean everyone has to finish in line with their £XI rank; teams do over- and under-achieve – it’s just that, over time, almost everyone tends to regress to the mean.
(I angered a lot of people by saying that Brendan Rodgers was on par when 5th towards the end of last season; but he’d also managed to finish 2nd – well above par. The Reds then fell to 6th – below par – but over his full three seasons he was “on par” with expectations. It regressed to the mean, from the high of 2013/14. The bad start to this season put him in negative equity, so to speak, and that’s why I felt a change would be welcome; and in the summer I stated that if someone with a genuinely better record, like Jürgen Klopp, was available, it would be worth getting him. Some managers can beat the model, but often by narrow margins, particularly at the top end of the table.)
We’ve shown in the past that football changed dramatically in 2003, when Roman Abramovich arrived. This is not some arbitrary cut-off point, but essentially the year the “rules” changed. The figures before 2003 and after are radically different, so it makes sense to focus on just this new financial landscape.
From the point Abramovich arrived, the top teams became even more expensive than the rest of the league, and higher points tallies became the norm for champions – rising to an average of 88, from an average of 81 in the decade prior to his purchase of Chelsea.
A big wealth gap opened up: first, Chelsea spent massively at a time when the TV money fell, so they got rich at a time when other clubs had become relatively poorer; next, Man United increased their spending, to compete with Chelsea; then the TV money improved, at a time when qualification had increased to four Champions League spots for English clubs, which helped Liverpool and Arsenal close the gap on the rich two – but just a little. (Finally, c.2008, Man City became the second club to spend their way into contention based on new money, although their spending only essentially brought them roughly in line with Chelsea and United.)
The vastly different kinds of budgets clubs work to means that you can’t reliably compare how good a manager is by the number of points his team accrues; after all, 50 points with an expensive side is poor, yet 49 points with an inexpensive side is good – yet obviously 50 is a higher number (just as you’d expect to win at least 60% of your games with a big-budget side, whereas for a small-budget side a 30% win-rate might be considered excellent.)
The different budgets are key. However, as I’ve said many times in the past, this does not mean that a manager working well with a limited budget can automatically handle the different kinds of pressures at a bigger club. I recall writing many years ago (c.2010) that David Moyes, so feted by many in the media, would quite likely fail at a bigger club than Everton; I just never believed the oft-stated mantra “imagine what he could at a club with real money”.
Moyes’ tactics and personality didn’t seem suited to a club like Manchester United. That doesn’t mean his failure there makes him a bad manager, but scaling up ideas is not a given: could his tactics be positive enough to win a much higher percentage of games? Could he handle bigger egos? Could he deal with the greater number of matches? Could he provide the excitement that his predecessor had made the norm? Could he inspire the fans? There’s no doubt that he had some very good league seasons with Everton, but there’s less scope for overachievement the higher up the league you go.
Comparisons
To really delve into this issue, I wanted to see how many points each manager achieved each season with his £XI, but I also wanted to compare it against the average cost of achieving that points tally; i.e., if someone manages a team that finishes with 60 points, was that done on a smaller or larger budget than the average for 60 points? Ditto for 40 points, 59 points, 87 points and so on (with the points tallies being grouped into fives, i.e. 51-55, 56-60, 61-65, etc, from which to take the average £XI). I could then measure the over- or- under-achievement against the norm.
Such numbers could never take into account all the vagaries that affect a season – all kinds of immeasurable stuff happens (as well as things like luck, that can in some ways be measured, but not easily so). It’s almost impossible to explain with this why Chelsea are where they currently are, or indeed, why Leicester are so high; all I’d say is that after 38 games there’s usually a much clearer adherence to the model than before even half of the games have been played.
Even though the model is not perfect (none is), it could perhaps tell an important part of the story. Do certain managers continually overachieve? Do others regularly fall below expectations? And what about the effects of cup football?
Of course, league points may be easier to attain in some seasons than others, but then in some seasons it might be easier to finish 7th rather than 8th, or 12th rather than 13th, or whatever. There may not look like much difference between a team that finishes 9th and one that finishes 10th, but there could be a gulf of 10-15 points. So for the sake of this study, points seemed a more interesting measure than finishing position, not least because I could look at Cost Per Point, which is more varied than cost per league position.
The only real problem I encountered when doing this is making judgements right at the very top of the table. For example, the sample size for 90+ points is very small indeed: just four examples since 2003. Jose Mourinho achieved it twice, in 2005 and 2006, but on a massive budget. Alex Ferguson achieved it once, in 2008/09, but on a large budget. And Arsene Wenger achieved it once, on a relatively small budget (albeit this was earlier in the “Abramovich Era”, in 2004, with a side assembled prior to the oligarch’s arrival).
By comparison, Wenger was massively under-budget and Mourinho massively over-budget – yet you can’t say Mourinho did a bad job when posting 95 and 91 points respectively. (Ferguson, in the middle, merely achieved his titles as “par”, which again perhaps undervalues those achievements; his titles were cheap in comparison with Chelsea’s, but expensive in comparison with Wenger’s.)
Indeed, you can’t say that Mourino did anything less than an excellent job a decade ago, even though he had unprecedented wealth – the kind of advantage not seen before or since in the English game (and relatively speaking, a much greater budget than he’s had since returning to the club, which, in part, explains why he hasn’t done so well second time around – although doesn’t explain why they have lost nine of 16 games).
Mourinho had the advantage of massive wealth, but – in the Premier League at least, between 2004 and 2006 – did about as well as anyone realistically can expect. However, other people achieved similar feats on lesser budgets, so it suffers by comparison. So I would preface the rest of this piece by saying that the three most expensive club £XIs – Chelsea, Manchester United and Manchester City – suffer in terms of how to assess “expectations”. (Anything less than 90 points doesn’t seem good enough.)
Therefore, it’s much clearer to see smaller clubs over-performing on a limited budget, and big clubs under-performing on massive budgets.
In relation to the Cost Per Point (the £XI divided by the number of games), then over the past 12 seasons – i.e. when the Title Zone kicked in – then it costs almost exactly £3m per point (on average) to win the title.
In other words, the champions’ £XI averages £260m, with 88 the average number of points. (Obviously the title could often have been won with fewer points – they just needed to accrue more than the runners-up. However, these are the points tallies the champions posted.)
So we can safely say that if the average cost per point (CPP) runs over £3m, and a title isn’t won, something is wrong – maybe slightly, maybe seriously.
And yet of the 12 most expensive Costs Per Point since 2003, only one was a title-winner: Chelsea in 2006 (£3.7m per point. Chelsea last season came in at £2.9m per point, their lowest title-winning amount of the modern era – although still slightly more expensive than City’s two titles.)
Title-challengers have to expect to have high costs per point; it seems necessary to have lots of expensive players to even contemplate being champions (which is why I think Leicester will fall away and do well to finish 6th; the same drop Southampton made last season from 2nd to 7th). So there’s not necessarily any great shame in finishing a close 2nd with a CPP just under £3m. However, the lower down the table you finish, the lower the average CPP for such points hauls; and therefore, if a manager has fielded an expensive £XI, and posted a low points tally, the greater the chance of coming off poorly in comparison with the norm.
The Worst Performers
The ten worst Premier League performances, in terms of the Cost Per Point compared against the norm for such a tally, averaged a finishing position of 7th (59.1 points) with an £XI in keeping with finishing 2nd, and a CPP of champions (£3.6m). There are some very high profile managers in the list – some exalted from successes elsewhere, others based on past Premier League achievements – although in league terms at least, these were obviously their anni horribiles.
In amongst the worst 10 are two 2nd-place finishes, both for Chelsea, where Jose Mourinho and Carlo Ancelotti racked up a low number of points in relation to the cost of the £XI. (In other words, if you have a Ferrari, you expect it to go very fast, or there will be questions asked.)

There are also the two most recent complete seasons for Manchester United; an 11th-place finish from Spurs; the poor league showing for Liverpool under Kenny Dalglish in his one full season back at the club; and two inclusions for Newcastle – one where Bobby Robson fielded a very expensive side and only finished 5th, with 56 points, and one where the Geordies finished 18th (and were relegated with just 34 points) on the kind of budget that should be getting c.65 points/top six.
What’s interesting here is that two of the four worst CPPs – in relation to what that “should be buying you” – include truly exceptional circumstances relating to cup competitions. The same is also true of the 11th-worst season, and also the 24th-worst.
Chelsea’s 64 points in 2011/12, at an average of £4.3m, scores as the worst value in the past dozen years, and yet on top of winning the FA Cup (which I like to try and forget) they more famously won the Champions League. In the same season Liverpool notched just 52 points, and finished 8th, but made it to both domestic cup finals, winning one, and being beaten by Chelsea in the other. The Reds had a massively expensive £XI for a team that finished 8th (i.e teams that finish 8th should be much cheaper), but they probably would have finished higher had they not played so much domestic cup football, especially with many of the fixtures against top teams and rivals (although this theory is not easy to prove).
The 11th-worst team in the list is the one Rafa Benítez inherited from Roberto Di Matteo a third of the way through the 2012/13 season, which ended up with 75 points on a budget more suited to 85+ points. However, this is the team that played the most cup football of any club in the Premier League era: 27 cup games (compared with the 25 Liverpool played when winning a cup treble in 2001, for example, which meant they played every possible cup fixture that season).
Benítez’s 2005-vintage Reds is the aforementioned 24th-worst team (out of 240) in terms of league position versus costs, but again it came when making it to the League Cup final and, far more notably, winning the Champions League against all odds. (Although of course we don’t like to talk about Istanbul, and all that…) It was Benítez’s worst CPP as Liverpool manager, with a reasonably high £XI for a 58-point finish, but this is another clear case of cups impinging on league form, either by design (because managers prioritise the competition they are going well in, and field weaker sides in the league) or due to fatigue and fixture pile-ups.
Most of the other examples of underperformance, however, are simply of teams having a terrible season, with no obvious extenuating circumstances. (I’ll revisit the impact of cup games in more detail later in the piece.)
Roy Hodgson’s Liverpool were on course to finish as one of the worst-ever seasons, but in this instance Dalglish rescued the situation. Derby’s relegation in 2007/08, with just 11 points, sits within the bottom 30; it was a fairly cheap team, so not too much could be expected, but they racked up such a paltry number of points that it ranks as well below-par (even the cheapest teams usually manage 20+ points).
Two of the most interesting examples are in the bottom five, however, with Manchester United’s two successors to Alex Ferguson. David Moyes did very poorly indeed, racking up just 64 points with an £XI (£257m) that is more-or-less the average cost of title-winners. However, by these measures, Louis van Gaal scores even worse: he racked up more points (70), but with an £XI that had risen to £333.7m – so up there with the costliest title-winners.
So while Moyes scores very poorly against the average of 64 points, van Gaal scores even worse against the average cost of 70 points; all that extra expense should have ‘bought’ more than a six point increase. (Of course, both managers were in their first season, so some leeway could be granted for the transitional phase. That said, van Gaal didn’t even have European football as a distraction last season.)
Ferguson’s worst season in terms of CPP was 2005/06 – a fairly expensive team that didn’t do too well – and yet that still ranks some 60 places higher than the best seen since his departure. (Of course, this is all post-2003 – although Ferguson never had a really bad season in the Premier League era. However, I imagine that if we had the time and resources to take our Transfer Price Index work back beyond 1992 we’d see some equally bad statistics in one or two of Ferguson’s first four seasons in English football, as he worked with what was probably the country’s most expensive side in the mid-to-late ’80s. He went on to do an amazing job, but famously, only after a torrid start – which gets used to show that all managers need time, when, of course, time can also work against managers: boredom with his team-talks and tactics, and so on. Also, giving time to the wrong managers means they can sell good players and buy bad ones.)
However, Moyes and van Gaal’s blushes may yet be spared: Chelsea’s Cost Per Point at the time of writing (15 points after 16 games) is £6.7m, which makes it over £5.8m more than the average for just under one point per game/38-pro rata.
In other words, if you were to add both Moyes and van Gaal’s seasons together (£4.5m) you still wouldn’t attain the level of underachievement currently shown by Mourinho’s team. That said, I’m pretty certain that Chelsea will rise up the table by a minimum of a few places (and even if the cost of the XI remains consistently high, the higher up the table they are the less harshly they’ll be judged; the lowest any team on a similar budget has finished is 7th: Moyes’ United). That said, it’s hard to see Chelsea breaking into the top four, and the longer this goes on, the top seven. Barring a miracle this will still rank as one of the worst 10 seasons by any English club since 2003.
By contrast, Leicester are on course for the most remarkable Premier League season since 2003, and if we’re honest, dating back a few more decades. But Southampton were doing almost as well this time last year, and in the end ranked ‘only’ as the 9th-best season in this study. Leicester have a cheaper £XI, mind, and more points per game. But the level of their overachievement will only be accurately measurable come May.
The Best Over-performers
Again, it’s worth reiterating here than any manager with a really expensive £XI has almost no scope to overachieve – their aim is to simply not underachieve.
Chelsea, Man City and Man United usually field £XIs so expensive that they’d have to get 100+ points to go beyond what is realistically achievable with their current levels of outlay. (If these clubs ever had a season-long injury crisis, and fielded their least-expensive reserves and youth team graduates, they could of course outperform the model – they would have a much lower £XI. But they usually end up fielding their expensive squad players – i.e. their costly insurance policies – and the £XI never really drops by too much over 38 games. Equally, none of them seem to gamble on youth anymore, beyond one or two players, and that helps ensure that the £XI stays high.)
There is an interesting mix of clubs and managers in the over-performance top 20 – with a 50-50 mix of continental and home-grown over-achievers. Even more interesting is that it covers overachievement in finishing as high as 1st and even as low as 19th.

To help prove that there is zero bias in this (as with all our TPI work), a recent Everton season ranks top, whilst one of my least-favourite managers, Sam Allardyce, also scores well – with three of his Bolton seasons in the top 20, at 10th, 11th and 20th. I may find Allardyce oafish and grinding, but he usually gets good results.
Roberto Martinez posted what I rank as the best Premier League season since 2003 (by these measures) – in 2013/14, when amassing 72 points with an £XI of just £53m, but which was overshadowed at the time by Liverpool and Man City’s fight for the title. David Moyes’ 2004/05 vintage rank 4th-best out of 240 – although perhaps he sipped the champagne on Sky a bit too prematurely with regards to being in the Champions League. Meanwhile, Mark Hughes’ Blackburn (2005/06) sits between, in 3rd place – a hefty 63 points on barely a mid-table budget. Speaking as a neutral, it’s not a team I remember as being particularly special, so it’s nice to see what might be an under-appreciated campaign get some praise.
Ian Holloway is included twice, although in the case of Crystal Palace the points were mostly accrued by Tony Pulis; Holloway’s Palace were nowhere near that kind of level. His Blackpool, however, could be very proud of their 39 points with the cheapest £XI out of the 240 included in this study, even if they were relegated.
Arsene Wenger is the master of upper-table overachievement, in part because he’s kept Arsenal in the top four every year, posting points tallies that range from respectable to very good, on what is often a very limited budget for the upper-reaches (particularly during the early Emirates-financing years). He accounts for five of the top 20 season finishes, with another season just missing out, at 21st. Of course, he has managed the same club for all 12 seasons covered, so he has a greater chance of multiple inclusions than those who have only spent a year or two in England. Even so, his consistency is outstanding, even if the Gunners no longer win league titles.
Whilst on the subject, Arsenal’s £XI, as previously noted, has been getting increasingly more expensive for the past five seasons; meaning that this season, taken as pro-rata, Arsenal’s current Cost Per Point isn’t anything that special; it would rank 75th against the 240 club seasons covered. The key difference, of course, is that the £XI (c.£190m) is edging up towards the Title Zone minimum of £236m, and if that minimum threshold were to be lowered by Arsenal winning the title, then it won’t be by a massive amount: a 19% drop, as opposed to the 40% drop if Liverpool had won it in 2014. Still, it would rank as a great achievement all the same. (And remember, Wenger’s first two titles with Arsenal came with the league’s most expensive £XI each time.)
The much-maligned Rafa Benítez has two seasons in the top 20 – 7th (2008/09, 86 points) and 12th (2005/06, 82 points) – and another just outside (23rd), with the 76 points picked up in 2007/08, when Fernando Torres burst onto the English scene. All of these £XIs were less than half of Chelsea’s at the time.
Another Liverpool manager makes two appearances in the top 20. Brendan Rodgers’ runners-up finish in 2013/14, with 84 points on a budget comparable with Benítez’s Reds, ranks 16th, while Rodgers’ 47 points with a very cheap Swansea side also makes the cut, at number 19.

PART TWO
The Cup Impact
Whilst on the subject, Brendan Rodgers makes for an interesting – nay, startling – starting point with a comparison into the impact cup competitions might make on league form.
To date he has managed four full seasons as a Premier League manager (plus a handful of games this season) – three with Liverpool and one with Swansea. Two of his seasons (one with each club) rank in the top 20 for the best performances since 2003. However, his other two seasons (both with Liverpool) rank in the bottom 30.
Now, all manner of different things may have occurred in those seasons that won’t show up in these numbers (the same goes for this season, when his side played in the Europa League). But in his ‘bad’ league seasons his team faced 16 cup games (2012/13, his 2nd-worst season) and then 20 cup games (2014/15, his worst season).
However, his two best seasons – Liverpool in 2013/14 and Swansea in 2011/12 – saw his sides play just five and three cup games respectively. So his poor league seasons saw an average of 18 cup games played, and his good league seasons saw an average of just four. (Liverpool had already played three when he was sacked.)
Another ex-Swansea manager based on Merseyside makes for another interesting comparison. While Roberto Martinez ranks #1 with his 2013/14 Everton, the following season (when the cost of the £XI rose by c.50%) his side were fairly poor, ranking 205th out of 240. Another difference here is that in his successful season the Toffees played just six cup games; a year later, when things got tougher, they played more than twice as many, at 13. Was this the Europa curse?
Obviously the amount of cup games a club can handle depends on the depth of the squad, and whether or not they are used to the extra demands. And even the biggest squads can come unstuck when tough league games are scheduled around tough cup fixtures, particularly in Europe.
However, only once in the top 80 ranked club league seasons (for over-performance) did a side play more than 21 cup games. And yet you only have to look at the bottom 11 ranked club seasons to find three instances. In the bottom 80 there are no fewer than seven seasons where a club played 22 or more cup games.
Steve McLaren’s worst performance at Middlesbrough was 2005/06, when they played an astonishing 26 games – just one fewer than the Di Matteo/Benítez Chelsea season, that ranks as the highest number of cup fixtures in the Premier League era.
Jose Mourinho’s 2014/15 title-winners played just 16 cup fixtures, which is a fairly low amount for a club guaranteed at least eight matches (six Champions League group games, and one each in the two domestic cups, being the minimum).
There’s not a huge difference in performance between Wenger’s half-dozen seasons when his team played 20 or more games (20-23 games), to the six times when they played fewer (15-18 games). However, those extra games seemed to cost the Gunners an average of one league point, and on average they finished a fraction lower in those more demanding seasons. The Cost Per Point was reasonably better with fewer cup games, and perhaps most interestingly, the only season where the Gunners clearly underperformed in the CPP measure was 2005/06, when they reached the Champions League final – which coincided with their worst league points total of the study: 67.
David Moyes’ best two seasons with Everton involved just six and seven cup matches. His 3rd, 4th and 5th-ranked seasons ranged from 10-16 cup fixtures, while none of his five worst seasons broke into double figures for additional matches. This fits with the cup study I undertook last season, which showed that clubs in a bad way don’t necessarily get out of it by playing fewer cup games; a slump is a slump, poor teams are poor teams, and during bad runs a club can easily slip out of the cups. However, if the team is in good shape, then fewer cup games seems to help, up to a point. At Everton, Moyes averaged less than nine cup matches per season.
Rafa Benítez’s highest-ranked season at Liverpool (2008/09) involved the fewest cup games of any of his six campaigns: 17 (which is still a fair amount, and more than Chelsea were involved in last season). The season when his Reds played the most games – 22 in 2004/05 – resulted in his lowest-ranked league performance. Indeed, Benítez’s time at Liverpool saw him average the highest number of cup games in this entire study, at 19.7 per season (while his partial season at Chelsea saw him oversee an astonishing 20 cup fixtures in just six months. Out of interest, his tenure at Napoli averaged 18 cup games).
Like Benítez, Arsene Wenger seems to guarantee a lot of cup games: 18.8, which is virtually identical to Alex Ferguson’s 10 seasons after 2003 (18.9) and Jose Mourinho’s (19.0). As rank outsiders for the title, but managing clubs steeped in trophy success, Benítez (at Liverpool) and Wenger may feel pressure to compete for the trophies that are a bit more winnable; but my hunch is that they make winning the title – always an outside bet – tougher.
Perhaps Jürgen Klopp is feeling the same at Liverpool, although managers seem to believe that cup success can lead to a winning habit. It can possibly be seen with Man City in 2011, and maybe even Arsenal this season – although their £XIs became more expensive by the time they were challenging for league titles.
At City, Roberto Mancini averaged 16.7 cup games per season (excluding the season where he took charge midway), while in his two full campaigns Manuel Pellegrini’s City have averaged “just” 15.5 – which is fairly low for Champions League perennials. (The average number of cup games for all Premier League clubs is a fraction under 10.)
Mancini’s worst league performance was the season when City played the most cup games (21, in 2010/11, when they racked up 71 league points and won the FA Cup); they played a less demanding 16 cup games in the season he landed the title. However, Pellegrini’s title, secured with 86 points, was won with a reasonably hefty 19 cup fixtures, whereas the disappointing defence of it (2nd, 79 points), involved just 12 additional games.
Neither of Carlo Ancelotti’s two seasons at Chelsea involved a high number of cup games, although the title was won with 86 points when playing 17 additional fixtures, and they racked up only 71 a year later, playing an additional 14 matches.
Harry Redknapp’s worst of three full seasons at Spurs (62 points in 2010/11) involved the highest number of cup games (15), with the others following in descending order, albeit with 14 and 12 cup games respectively – so no major difference, even though his best season saw his side face the fewest extra games.
Surprisingly (to me, at least), Andre Villas-Boas’ Spurs rank higher (14th) than any of Redknapp’s sides, with 72 points from a team (£XI) that cost £102m; even though they only finished 5th. Redknapp’s best season saw them finish 4th, with a more expensive side (£118m), and, at 70, two points short of the Portuguese’s best. Villas-Boas’ season was also one in which Spurs played more cup games – 16, to the 12-15 range under Redknapp. But the following season the young Portuguese manager was having a torrid time, and it needed Tim Sherwood (of all people) to lift the team’s ranking, and even then they limp in at 162nd.
Sam Allardyce, whose three Bolton seasons post-2003 rank in the top 20, performed worst in the campaign where his side played 15 cup games; in the two better seasons his side played just nine and six additional fixtures. His highest number of cup games since leaving Bolton in three full seasons at West Ham and one at Blackburn is just seven.
Mark Hughes, another perennial overachiever with smaller clubs (but who like Allardyce, Hodgson and various others, failed in his biggest Premier League appointment to date), had his best season with Blackburn – the aforementioned 2005/06 campaign, which ranks 3rd out of 240 – with just eight cup matches; compared with the 15 they played the following season, when dropping from 6th with 63 points to 10th with 52. Again, the Europa curse, or just a club regressing to their ‘usual’ level?
Hughes’ one full season with Man City also saw a 10th-place finish, with just 50 points – but with an £XI that should have been gaining a top six finish (as the overseas investment began to take effect); and ranks in the bottom 20 (221st out of 240). However, it did involve 18 cup matches, which was a massive jump from seven, six, six and three in the club’s previous four seasons.
Only twice since 2003 has the league title been won by a team playing more than 21 cup fixtures (Man United both times, in ’07 and ’09), although the average number is 18.8, with Chelsea’s 2005/06 the least tested by extra games, at just 15.
This would suggest that being useless in the cups doesn’t give teams an edge when it comes to becoming champions, although all the champions came from the Champions League regulars (no title since 2003 has been won by a club who didn’t also play in Europe’s premier competition that season), and as mentioned earlier, therefore guaranteed eight games across Europe and the two domestic cups.
It would be wrong to say that a club has to play in 15 cup games to stand a chance to winning the title; but as things stand, cup-regulars always win the title.
And yet the average finishing position for a team playing more than 21 cup games (which has happened 11 times since 2003) is 5th, with 71 points.
Two of these achievements were by clubs well adrift of the Champions League gravy train, who would only be expected to finish mid-table: Boro in 2005/06 (26 games) and Fulham in 2009/10 (25 games). These two clubs finished slightly below where expected in the league (14th and 12th respectively), and it’s not really any surprise, given the extra demands. Indeed, they can count themselves lucky that they weren’t relegated, which was a fate that has befallen a few cup finalists in recent seasons.
Remove Boro and Fulham, and that leaves nine remaining Champions League regulars who played more than 21 cup games (a mixture of Chelsea, Man United, Arsenal and Liverpool). These nine average out at a finishing position of 3rd, with 77 points.

I’ve said it several times when talking about Liverpool, but Benítez teams put so much into cup competitions that it probably harmed the Reds chances in the league; and yet 2005, 2006 and 2007 involved great drama, with two domestic cup finals and two Champions League finals (the first was luckily won, the second unluckily lost). Both he and Wenger were working on smaller budgets (and therefore with smaller squads) than the richer clubs. As noted earlier, it’s not always easy to sacrifice the cup competitions if you’re only outsiders for the title, as finishing trophy-less brings its own pressures. And having fewer cup games doesn’t guarantee anything.
Cup complexity?
Now, if I had a spare year or two I could go through and work out how tough (theoretically) each cup fixture was, but that’s not practical.
Overall, the top 20 ‘over-performing’ seasons in the league saw an average of 11.4 cup games played, whilst the bottom 20 average at 14.6 cup games.
So can we say that cups definitely increase the chances of damaging league health? I would say yes. However, it’s hard to measure the confidence that can be taken from winning trophies, and indeed, going on good cup runs (i.e. momentum, if it really exists).
The Europa League may indeed be the main culprit, although I’d need to look more deeply into this. It’s possibly problematic because it has as many – if not more – games than the Champions League, and as much travelling, and although Thursday-Sunday is the same in terms of recovery time as Wednesday-Saturday, quite a few Champions League clubs play Tuesday-Saturday (one extra day) and also Tuesday-Sunday (two extra days). There’s also the added pressure of regularly playing your game a day after everyone else, which perhaps adds a sense of playing catch-up. And of course, the teams that compete in the Europa League tend to have smaller squads than those who play in the continent’s elite competition.
By contrast, the League Cup can usually end up resembling a quasi-reserve/youth competition, although having the final so early in the season can lead to a sense of anticlimax in the following league games, whether won or lost.
Even so, it’s tough to judge the intensity of the cup games, the timing of those games, and the quality of opposition, just by looking at the number of matches played in any given season. So that, and other factors, need to be taken into account (and will be, if I ever get the time.)