By TTT contributor and subscriber Krishen Bhautoo.
I recently wrote a piece about How We Compare with Our Rivals in which we looked at how we are progressing statistically and where there is room for improvement. JCP made a fantastic point regarding how we are looking at our defensive statistics. In short, his point was that if you have the ball more than the opposition, you need to make tackles and interceptions less often, therefore how good are we at doing that?
I thought this was a fantastic point and one that I’d never considered nor seen before, only the ‘per minutes’ statistics. It also applies to attacking. If you have 60% possession and nine shots, are you that much better than your opponent who had the other 40% possession and just six shots? On the face of it, yes as you have had more shots. But when the figures are broken down, both teams have the same number of shots per minute in possession.
Ok, that was a very simplistic view, but the purpose of this piece is to see if there is any correlation between how good (or bad) you are in possession and league standing. After all:
If you are better than your opponent with the ball you have a 79 per cent chance of winning the game. For me it is quite logical. It doesn’t matter how big or small you are, if you don’t have the ball you can’t score.” – Brendan Rodgers
Using data from this season would be a little unfair. There have only been eleven games so far and that doesn’t give a big enough data set to work with. Instead I am looking at last season’s data with all data sourced from EPL Index and WhoScored.com.
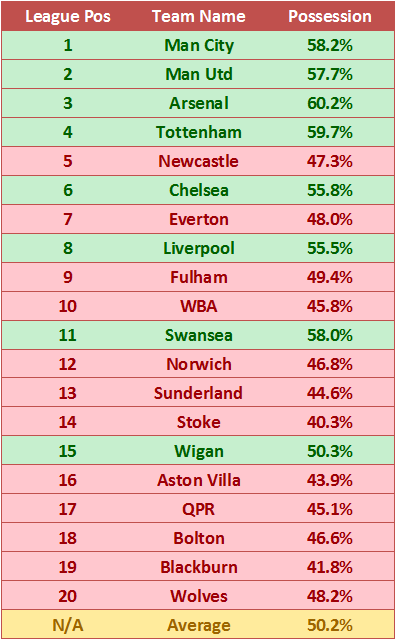
The table is sorted by the final league standing, with teams in green enjoying a possession stat higher than the league average and the teams in red a lower than average.
As we would have guessed, the teams with a higher possession stat tend to be higher up the table. Whether having more possession, meaning that you automatically gain more points or possession, is a by-product of being a better team is open to debate – my first instinct is that it is. But as Rodgers says, you have to be better than your opponent with the ball to win the game.
Firstly though, I’d like to look at how we defend when we are out of possession.
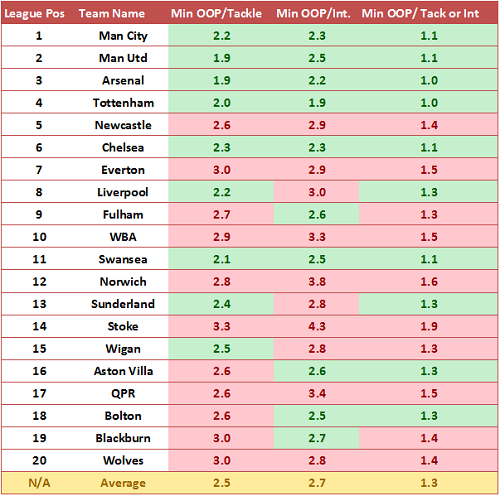
It would seem that when out of possession (OOP), teams higher up the table regain the ball more often. A small caveat is that the Tackles stat is the number of tackles attempted, not just successful ones. Even so, there seems to be a clear correlation. One could argue that the teams higher up the table have better players (in general), therefore would regain possession more often, but even when you look at just the Min OOP/Tackle stat, teams lower down the table tend to attempt to make a tackle less often.
Regarding interceptions, it could also be argued that the better teams have players that are able to read the game better than the others so should be able to make those interceptions. There isn’t a huge correlation with interceptions and league position, but the top five clubs were in the top seven for interceptions, with Swansea and Bolton making up the other two places.
Rodgers’ Swansea team should take some praise here. Their attempts to regain the ball were as frequent as the Manchester clubs, with their possession slap bang in the middle of the top two. Just on these two metrics, it should bode well for the future at Liverpool.
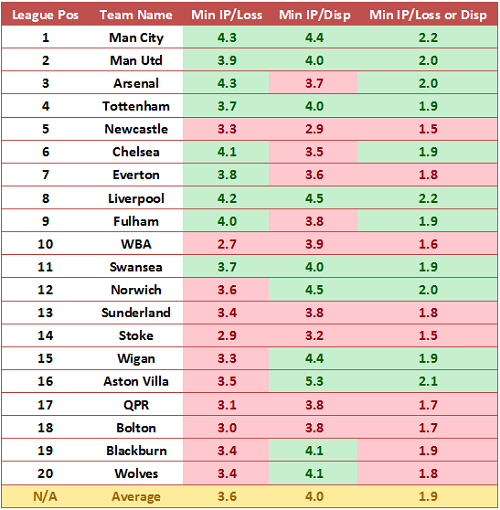
There is a slight correlation here. Minutes in Possession per Loss of Possession (Min IP/Loss) strongly relates to how up the table you are. To put it simply, better teams tend to lose the ball less often when they have it. Seems fairly obvious as the better teams will have better players, better possession ratios and will therefore keep the ball better.
When we come to Minutes in Possession/Dispossessed (Min IP/Disp) it seems much more scattered, with every team being affected in different ways. Without going into tactical analysis of each team’s style of play, the stats for this metric don’t tell us a great deal.
Again, Rodgers’ Swansea manage to keep up with the big boys, allowing some optimism for the future here. And it should also be noted that Kenny’s Liverpool fared very well across all three stats. In fact, we lost the ball last season less often that anyone in the league except Man City.
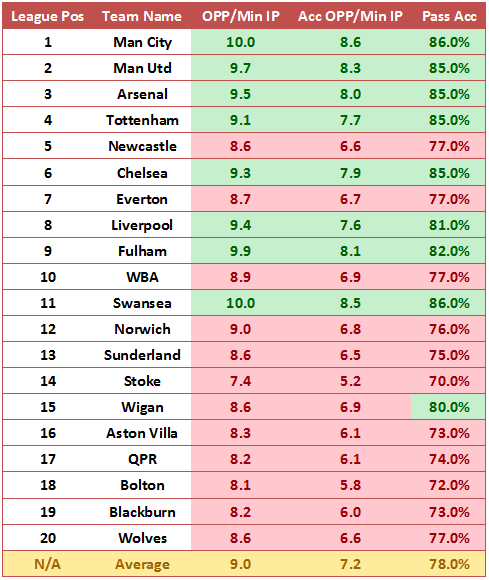
Yet again we are seeing a strong correlation. Better teams make open play passes (OPP) more often than ‘worse’ teams. Obviously, they are passing the ball more often as they will likely have better players and will be playing against ‘worse’ teams the majority of the time.
If we look at Man City (or Rodgers’ Swansea), we can see that their players pass the ball ten times a minute (or once every six seconds). Stoke on the other hand pass it every 8.1 seconds. I would hazard a guess that those extra two seconds allow the opposition to regroup and close down the passer more effectively. Of course, Stoke play a distinctively different style of football to City or Swansea, but the principle would still stand.
Of course, making passes is one thing but completing them is another, and pass accuracy also seems a strong indicator of final league standing. Credit to Rodgers once again.
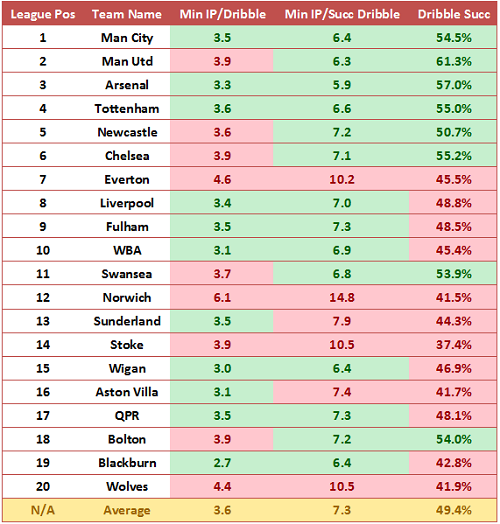
Everyone in the league attempts a dribble when they have the ball, some obviously more often than others with the frequency not really having a great bearing on final league standing (relegated Blackburn attempted to more often than anyone else in the league).
The frequency of successful dribbles has a fair effect on where you finish in the league. In this instance, the final top four were in the top six for the mins in possession per successful dribble, with Blackburn and Wigan making up the other two.
The difference clearly lies in the dribble success rate. Better players will enable you to have better dribblers, but also the style of play of the top clubs may be able open up space for your players to exploit.
Again, Rodgers’ Swansea does well. Nearly as good as City, with an entire squad that costs less than one Jack Rodwell!
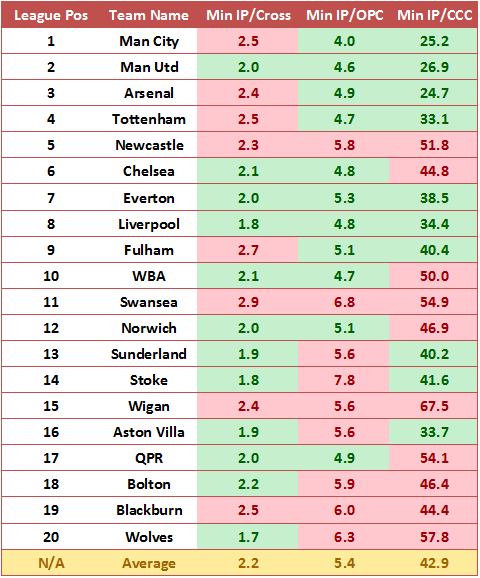
From the table we can see that the lower teams try to cross the ball more often than those higher up the table. Under Kenny we were guilty of Stoke levels of crosses when in possession – slightly counter-intuitive to how I remember us playing last season. Swansea actually attempted the least, putting them (and us) in good stead.
Of course, the better teams created more open play chances (OPC) as they are usually on the front foot. It would seem that we should be aiming for a chance every five minutes or so, which we did achieve under Kenny last season, but as we have seen above, many of those will have come from crosses which are one of the least effective and least efficient ways of scoring (although Man Utd made a similar amount of crosses to us. 1,018 to our 1,102).
Rodgers didn’t fare too well here. We could ‘cut him some slack’ as he was in charge of an inferior, or at least less expensive, squad to most, but his team still created fewer open play chances less frequently when in possession than the three relegated sides.
Clear Cut Chances is almost certainly the key to moving up the table. The top four in the league created clear cut chances more frequently than anyone else. It’s easy to say that creating these chances is what we should do, but to execute it is another matter. Especially when you take into account that we created the 6th most clear cut chances per min in possession last season, yet finished 8th. Looks like our old friend chance conversion will have come into play (let alone a few wonder ‘keepers and wider woodwork).
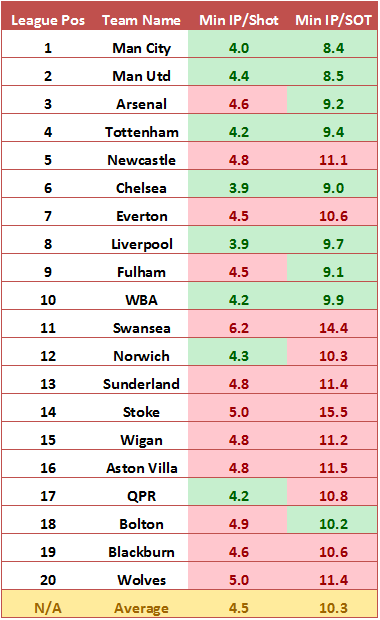
In general, the better teams seem to have more shots when in possession and definitely more shots on target – predominantly due to having better players, and most likely better tactics from better managers. Almost unsurprisingly, we had more shots when in possession than anyone else in the league last season, but only the 7th best shots on target per minute. This seems to have been our downfall.
Looking at Swansea’s stats, they were the worst for Min IP/Shot and second worst for Min IP/SOT. It didn’t do them too much harm last season, finishing a very comfortable 11th, but with just 44 goals (less than Bolton and Blackburn) it certainly won’t be good enough for Liverpool. If we maintain close to Kenny’s stats last year but increase our shot accuracy, we should be OK So far this season we are having shots on a similar level to Tottenham and Arsenal, yet our shot accuracy is only 34% whilst our main rivals for top four are averaging over 40%.
If you are better than your opponent with the ball you have a 79 per cent chance of winning the game. For me it is quite logical. It doesn’t matter how big or small you are, if you don’t have the ball you can’t score.” – Rodgers
So how good do we have to be when we have the ball?
Firstly, it would seem that the top sides have the ball for 57% of the time or more. Rodgers’ Swansea had the 4th highest possession stat last year with 58% and we currently enjoy a possession ratio of 57.4% (4th highest in the league).
In terms of regaining possession, we should be looking to do this about once a minute when we lose the ball. Of the six best teams to attempt to regain possession last season, five of them came in the top six with Swansea yet again crashing the party.
When in possession, we should be making sure we don’t lose possession for at least 3.7 minutes at a time. Swansea managed exactly 3.7 minutes last season, and we now manage a very healthy 4.5. In terms of being dispossessed there is no direct correlation.
With passing, the better teams maintain an average of nine passes per minute or better. Swansea managed ten last season (joint best with Man City) and we currently manage 9.5.
When it comes to dribbling, the number made per minute in possession bears little weight in final league standing. Nor do the Minutes per Successful Dribble (some teams with superior Min IP/Successful Dribble were relegated or were relegation candidates). The key factor with dribbles is the completion. 55% or better is a common with top four teams last season. Swansea managed 53.9% and we currently stand at 50.4%. Not good enough here. But with only two dribblers in the team (one of whom is just 17) it can be remedied with astute January signings and/or the improvement of others.
In chance creation, the biggest factor is the Min IP/Clear Cut Chances created. The top three did this every 25 minutes or so. Kenny managed it about every 34.4, whilst Swansea were the worst in the league (except Wolves) with 54.9. We currently stand at 46. Massive room for improvement, but as with the dribbling, this could/should improve with January signings and further as the system takes hold.
The six best in the league for Min IP/SOT contained the top four and Chelsea (with Fulham this time crashing the party). A rate of about 9.5 Min IP/SOT is a decent level to aim for. Last season we were just shy of the mark with 9.7, however Swansea were way off the pace with 14.4. We currently stand at a meagre 12.7.
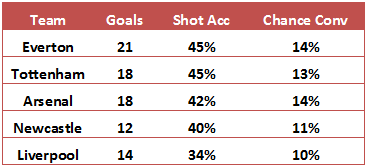
We can see from the table above that our accuracy and conversion this season is far from good enough. This is the key area we need to improve (as if we all didn’t know that?!).
In terms of whether we have a “79% chance of winning our games” I’d say yes and no. ‘Yes’ for possession, regaining possession and passing, where we are up there with the best of them. But it’s a disappointing ‘No’ in terms of dribbling, chance creation and shooting. The latter three can be remedied. As mentioned several times, the January transfer window and implementation of the system would seem to be key here. Rodgers’ Swansea didn’t exactly tear up any trees in the attacking sense last year, but with better players at Liverpool, a larger ‘shop window’ and bigger wallet, this should improve. I have faith in Rodgers being able to find the solutions.
