Liverpool can’t afford to win the league. And Liverpool can’t afford not to win the league.
While some people think that it’s Rafa Benítez who makes this so, it’s actually the realities of the financial world the club lives in.
While the book “Soccernomics/Why England Lose” could not find a direct link between spending on the team and league success (instead, their research showed that wages were the key factor), I feel that I’ve found that link.
From what I can tell, the problem with their research on the cost of the teams is that it covers 1978 to 1997, while the wages research is from 1998 to 2007. So the later research is the most relevant.
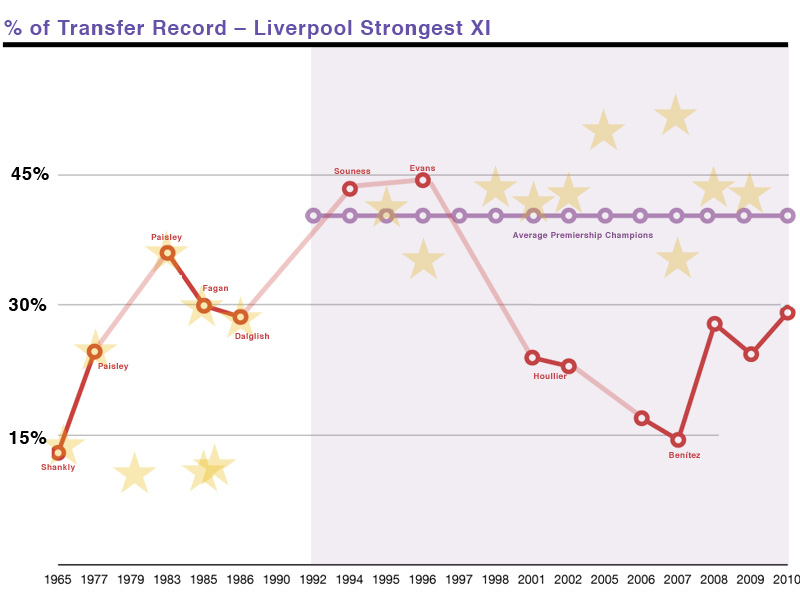
My own research, using the Relative Transfer System (RTS) I devised for “Dynasty: 50 Years of Shankly’s Liverpool”, showed that prior to the ‘90s, there was a massive fluctuation between spending on a club’s strongest XI and success. (The Premiership section of this research is taken from ‘Red Race: A New Bastion’, which can be downloaded for free by members of The Tomkins Times; see below)
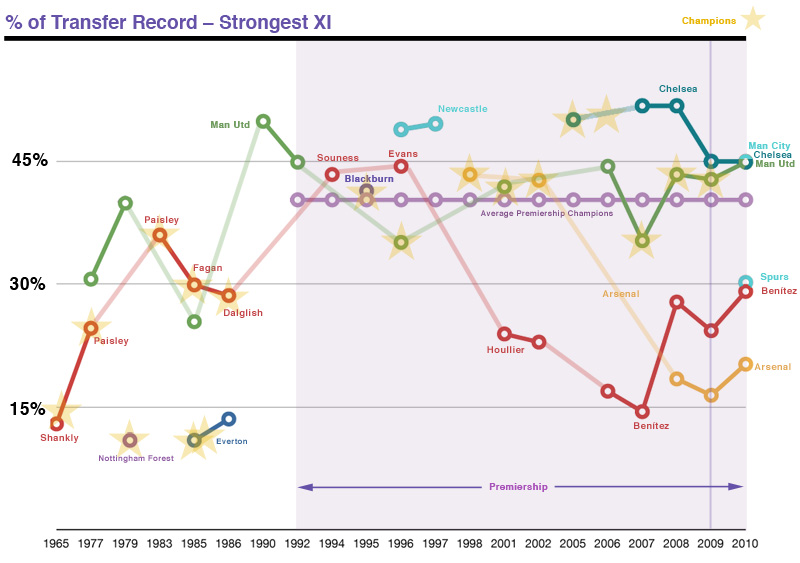
The RTS was created to ‘level up’ spending by comparing all transfers to the record of the day, with 100% being the transfer record, 50% being half of the transfer record, and so on. (The really expensive teams, like Chelsea, Man City, Blackburn, 1995, Newcastle 1997, and Man United in several seasons, tend to average around 40-50%.)
This was so that I could more accurately compare the spending of Bill Shankly with that, say, of Graeme Souness, and the spending of Souness with that of Benítez and Houllier, and so on.
This resulted in an average for each team, in percentage terms.
This told me that, in the 1960s, when Shankly twice won the title, the average cost of the team was around 13%. It also told me that the car-wreck of a team Souness assembled cost 43% of the transfer record; therefore, on average, each player was almost four times as expensive when compared against the transfer record of the day.
But what my research clearly shows (see graphs at the bottom if this article) is that prior to the money-rush of the Premiership, teams could win the league with very low averages.
One great example is the Everton team of 1985, which cost just 11% of the transfer record. (Incidentally, Everton spent massively in the late ‘70s, but it was only once they had the right manager that they found success, once all the expensive signings had moved on.)
Nottingham Forest (11%), Liverpool (13%), Everton (11%) – all of these teams won the old First Division with low spending averages.
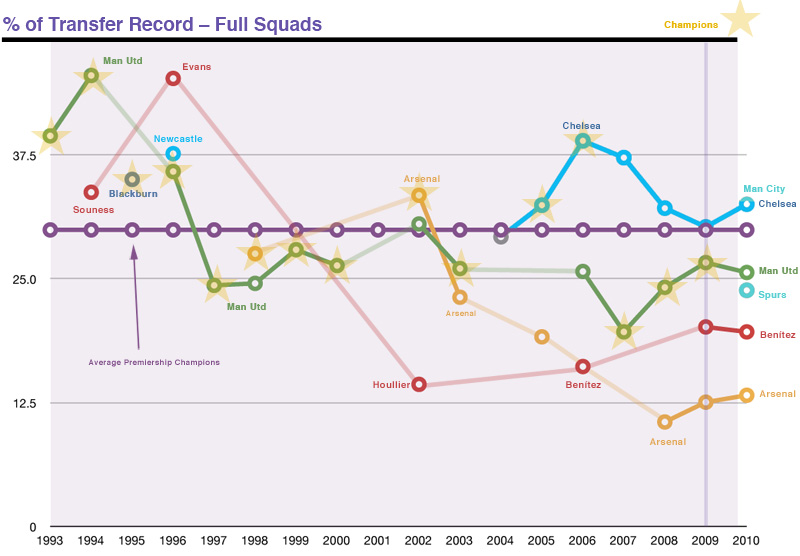
But once Man United won the inaugural Premiership title in 1993, the trend changed, and has not been broken once in the meantime. The lowest since then is 32%, for Arsenal in 2004, down from 42.8%, their previous title, in 2002.
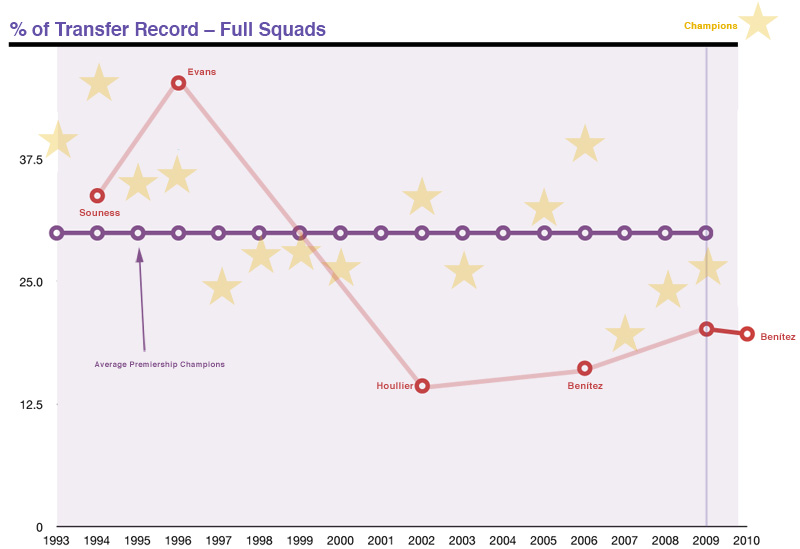
Whether going on the strongest XI or squad averages (which I also used with the change in the modern game), the same applies.
Not once has Benítez had a strongest XI or a squad average that reaches the minimum percentage ‘needed’ for success in the Premiership era.
And that is the key. Even Arsenal’s average when first winning the re-branded league title in 1998 was 43%. However, the cheaper Arsenal’s team and squad has got, the further away from the title they’ve fallen. And the average is even higher for these ‘first time’ champions, suggesting that it’s even harder to break a long gap without a title.
Wages
According to Soccernomics, wages explained 89% of the variation in league position in the Premiership and Championship between 1998 and 2007, and 92% of that variation in the previous two decades.
Their conclusion? The more you pay your players, the higher you finish. (Of course, this means having players worthy of that money; not just giving rubbish players pay rises. This is what I call the Michael Ballack Factor: free transfer, £121,000 a week.)
Between 1998 and 2007, Liverpool spent the 4th-highest amount on wages. The average league position was 4th.
This is what shows Benítez’s achievement in 2008/09 for what it really is – 4th highest wage bill, yet 2nd place finish, way above 4th place in terms of points.
Rather than a springboard, it seems that last season was a Herculean effort that was unrealistic to maintain.
This year, the Liverpool strongest XI average cost rose slightly, but the squad average dipped. And of course, the spending on Aquilani has yet to be translated into Premiership action, while Torres and Johnson have missed games with injuries. And perhaps this is where a “cheaper” squad bites the club in the behind.
Everyone can see that depth has been sacrificed, which was apparent when little money was available for a centre-back, despite Rafa posting a profit on his dealings in 2009, not least with the sale of Robbie Keane earlier in the year (and the apparent disappearance of that money). The one bonus is the development of players like David N’Gog, but he’s just starting out, as is Emiliano Insua.
It’s unfair to blame all of Liverpool’s monetary struggles on the Americans, because Liverpool had become financial also-rans before they arrived.
But it’s also true that they have failed to deliver the stadium that was part of the very reason the club was sold to them in the first place, and it’s unclear to pretty much all fans how the debt situation has been allowed to develop and be placed on the club. That wasn’t part of the takeover promise, and that’s why fans are angry with them.
But whoever is to blame, it’s important that fans understand how finances affect results, and to appreciate Liverpool’s place in the new landscape.
Liverpool have fallen behind Spurs and Manchester City in spending, and down to 5th in wages.
Up until this season, Benítez has overachieved in the league (2006 and 2009), and overachieved in Europe pretty much every single year. But can he be expected to do so every year?
The one bright spark appears to be Managing Director, Cristian Purslow, in more ways than one. He seems to understand what’s needed, and hopefully he can be true to his word. Surely he understands that without the overachievement on the pitch in the past few seasons, the coffers would be beyond bare?
‘Red Race’ is now available to for free download to Subscribers of The Tomkins Times, using the link below.
[ttt-subscribe-article]
Charts
Hopefully these are self-explanatory, but they do look a bit busy with all the information.
Basic rule: star = champions that year; straight purple line = Premiership Champions Average; red line = Liverpool, but annotated with manager’s name; lilac area = Premiership era.
All Premiership years are covered in terms of Champions, but only certain years between 1965-1992. Shaded lines join teams in absence of data.
Charts show Liverpool first, then all teams together, for Strongest XI and then Squad. You can see for yourselves how much higher the champions’ stars are in the Premiership era.


Note: while Liverpool’s strongest XI has gone up in cost this season, the team has yet to include Aquilani, and also seen other expensive stars frequently absent.

