By TTT subscriber Martin McLaughlin.
It’s been a few weeks now, but cast your mind back to 31st August. It all was a little bit slapstick, with Brendan Rodgers claiming he would be a sandwich short of a picnic to let Andy Carroll go without a replacement, only to embark on the season short of a substitute snack for the aforementioned pony-tail-filled sarnie.
It seemed like we suddenly couldn’t afford a £6m 29-year old on a three-year contract at the higher end of the pay scale. Just how much of this money did we actually have? Where did the money we saved on wages go? Where did the money we saved from interest payments go? How can we compete without deficit spending?
This article endeavours to answer some of those questions by looking at the last six years of published accounts and how they compare to the “top 6”. Unfortunately, complete accounts have only been published for all six clubs up to the period 2010-2011, the first six months of FSGs ownership. They do however give a very clear picture of what state the club was in and what is required to return the club to a stable and prosperous financial and footballing future.
First, a quick financial 101. In my simplified breakdown of footballing finances, income is composed of two items and expenditure is composed of six items.
Income:
1) “Turnover” – This is comprised of media, matchday and commercial revenue. This is a relatively fixed income which tends to rise in a steady and predictable fashion. As such, it provides a good reference for calculating percentages of other income and expenditure. This is why wages are often presented as a percentage of turnover.
2) Player Profit – Do not confuse paying cash for a player and how that is accounted for. You do not lose £50m when you buy a player, cash is converted to an asset, ie the player. However, if you sign him to a 5-year contract, in five years he will be worth £0 as he will be able to leave for free. Therefore, you must reduce the value of the asset by £10m per year in a linear fashion until it is worth £0 at the end of the contract (otherwise known as transfer amortisation). If after three years, you have written off £30m in value, you are left with a player who you estimate to be valued, in accounting terms, at £20m. If you sell him for £25m, you make a “profit” of £5m on the sale of the asset. We will come to player profit and its importance later.
Expenditure:
1) Other Expenses – These are the general running costs of a football club. Items such as stadium operating expenses, land and building lease and audit costs are often grouped as other costs.
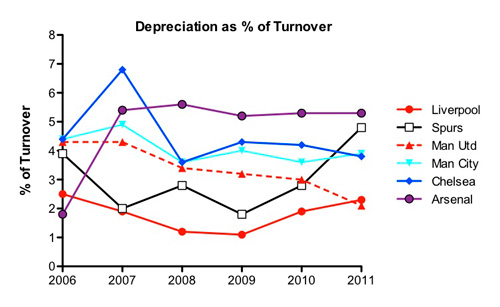
2) Depreciation – The value of “Tangible” assets, ie stadiums or equipment must be reduced over the course of their usable life.
3) Transfer Amortisation – As described in player profit above, buying a player simply converts cash into an “asset” with the value of the asset reduced to zero over its expected lifetime each accounting year, ie contract length.
4) Wages – This includes players, management, executives, groundstaff, the tea lady, everyone.
5) Financing Costs – Interest payments and all costs directly linked to debt financing (even if they are one off costs).
6) Exceptional Costs – Anything not included in parts 1-5 that is a one off, the most common is manager contract termination fees.
Before I begin, I will mention a very specific quote from the recent John W Henry open letter which I would like everyone to read, as it is a rather important point.
“The transfer policy was not about cutting costs. It was – and will be in the future – about getting maximum value for what is spent so that we can build quality and depth.” – John Henry
Part 1 – Where Did The Interest Money Go?
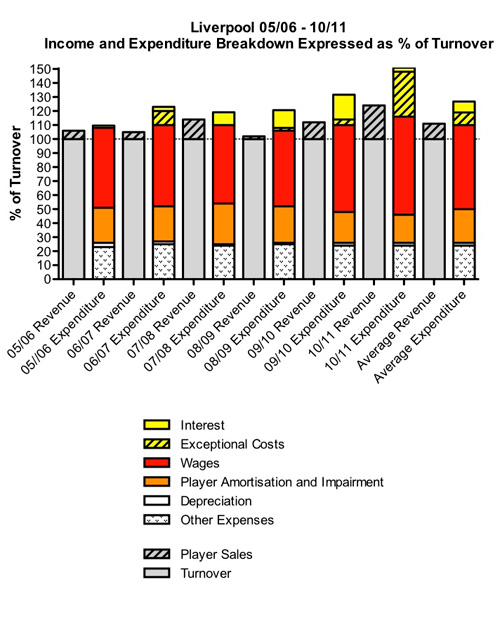
There has been something of an illusion which has built up around the Hicks and Gillett era that states Liverpool fell from competitive grace due to interest payments siphoning money from wages and transfers. I will put it bluntly, that is untrue. The figure below shows the income and expenditure breakdown for the years 05/06 to 10/11 with each area of income and expenditure expressed as a percentage of turnover.
The average revenue and expenditure is shown as the final two columns. The interest payments in solid yellow have been placed at the top to indicate that in almost every year, the loss corresponds almost exactly to interest payments only*.
*It should be noted that the holding company used by Hicks and Gillett to purchase Liverpool had cumulative interest of £87m from 2007-2011. However, this was never paid by the club and after the purchase by NESV/FSG there is no risk of this ever being a cost the club will have to incur. Therefore it has been excluded.
This figure of all income and expenditure is a little overwhelming. To more closely look at the impact of interest and exceptional stadium expenditure, the graph below shows the six-year cumulative profit before tax (which I will occasionally refer to as simply profit) for Liverpool and Manchester United. Interest and Stadium costs have been excluded to show their impact for each club [NB – the last expansion of Old Trafford occurred in 05/06 at a cost of £45m, but I have been unable to identify which year this was accounted for in].
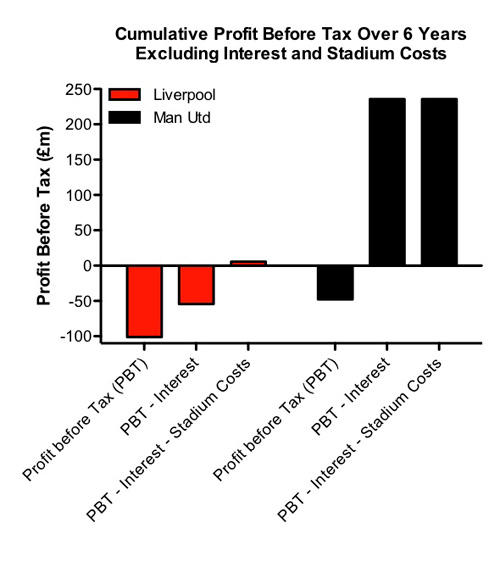 Notice how when interest payments and stadium costs are excluded, Liverpool over six years would have broken even, a £5.6m profit before tax actually. Manchester United is the perfect example of a club being drained by interest. They have made a cumulative loss of £47.8m over the period 05/06 – 10/11, but spent a mind-boggling £283.6m on interest and financing costs. Liverpool on the other hand were run with their fingers in their ears as to the accumulating cost of interest payments loaded onto the club (£46.8m) and stadium fees (£59.9m). We are talking about just interest payments here, not actually paying off the core debt. Manchester United are chipping away at their debt pile, Liverpool were adding to it. As for stadium payments, only £10.3m of stadium design fees in 06/07 had been accounted for. When FSG bought the club they found £49.6m which had been spent, but not written down in the books yet. £59.9m in total and no stadium, you have to wonder if they even bought a spade to put in the ground?
Part 2 – [It’s] the Wages, Stupid!
In a timely fashion, this article follows hot on the heels of Daniel’s excellent FFP article. FFP allows the exclusion of costs associated with stadium and other long term developments such as academy and training facility investment. Therefore, while we made a thumping great accounting loss of £49.3m, we can exclude £49.6m. While it’s nice that we can exclude this from FFP, FSG have said they will not run Liverpool at a loss. In that respect, FFP is somewhat irrelevant to Liverpool, they simply must break even, just as Arsenal, Manchester United and Tottenham do. FFP may rein in Chelsea and Man City, but Liverpool must still be run to break even if it doesn’t.
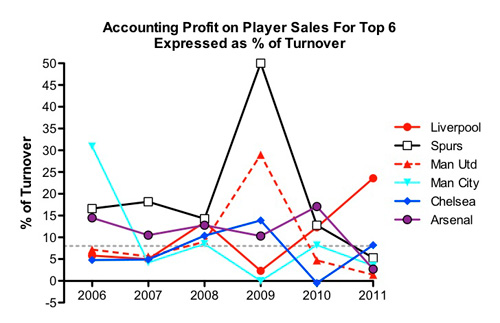
We aren’t going to write off £49.6m in stadium debt every year, so all is well – back to breaking even next year? Well, not quite. The next figure is player profit as a percentage of turnover; the grey dotted line representing an average percentage income over and above normal turnover for the top-six over six-years.
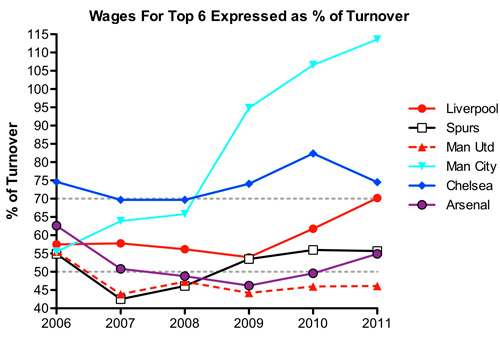
In 2010/11, Liverpool recorded the third-highest player profit as a percentage of turnover of the now top six in the last five years. This is only bettered by 2008/09 where Manchester United sold Cristiano Ronaldo, and also ’08/09 where Tottenham sold Dimitar Berbatov and Robbie Keane amongst others. This allowed Manchester United and Tottenham to pocket a cool profit before tax of £48.1m and £33.5m respectively. We must have pocketed a tidy profit as well then? Well, if you exclude the £49.6m stadium costs, we made a loss of £0.3m, so where the hell did it all go? Manager termination costs and wages, or Roy Hodgson and Joe Cole if you want an exact personification. Cue the dreaded wages to turnover figure.
Please try and ignore Manchester City and their bonkers wage bill for a moment. Instead look at the solid red Liverpool line. From 2006-2009 this was already undesirably high at around over 55 % of turnover. It is in 2010 and 2011 that things take a horrible unsustainable turn for the worse. In 2010/11, Liverpool spent 70% of turnover on wages – Chelsea levels of unsustainability.
What does this look like in real terms?
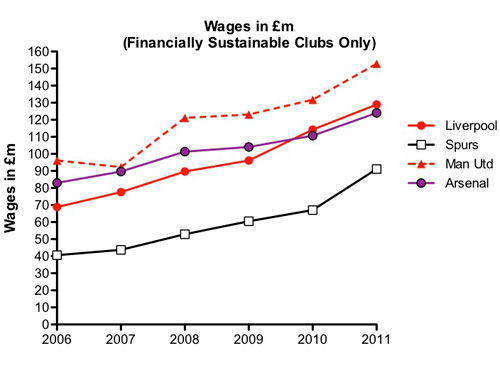 Look at the figures in real terms and ask yourself two things. Why can we spend as much as Arsenal and not match them in league position? Why can Tottenham spend so little and match Arsenal, Liverpool and Chelsea in league position? Clearly it’s not how much you spend, but how you spend it that is the key. Remember when looking at this graph that in 2010 our wages were already at 62% of turnover. In 2011 turnover was stagnant (£184.9m dropped to £183.7m in 2011) yet wages were allowed to rise by a further £15m to 70% of turnover. This was not an increase due to dropping revenue, this was a further escalation in uncontrolled wage spending.
Where did the money to pay this ballooning wage bill come from? The sale of Fernando Torres.
Part 3 – The “Exceptional” Manager Merry-go-round
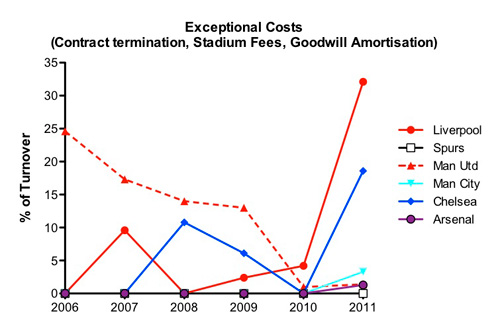
Football clubs occasionally incur “exceptional” costs. For Liverpool recently, these have become much less exceptional. The figure below describes exceptional costs as a percentage of turnover for each of the top six.
For Chelsea, their exceptional costs are terminating manager contracts as an almost annual occurrence. For Manchester United it is “goodwill” amortisation. This is because the Glazers paid more to take over the club than it was worth. They had been gradually writing off the difference, and this stopped in 2010.
Liverpool have spent money on contract terminations in 2009, 2010 and 2011, in addition to stadium costs for a stadium that was never built. In total, £20.5m in termination fees and £59.9m in stadium costs. Man City, Tottenham and Arsenal barely register. To say this is money we can ill afford to waste goes without saying. Combined that’s over two Andy Carrolls, or just over five Joe Allens in today’s money.
Combined with an out of control wage bill, it paints a picture of a period of epic financial mismanagement. You could wipe away the interest payments, but we had been borrowing money to pay the interest anyway. £80m wasted on sacking managers and a phantom stadium. A wage bill so out of proportion to turnover, players had to be sold to break even. This is the legacy of Hicks, Gillett and Purslow, this was the mess which FSG found the club in when they arrived. In this context, someone needs to ask John W. Henry, why on earth did he decide to buy such a financial train wreck?
Part 4 –The Tottenham Model
Up until this point there are a few things in the financial narrative I haven’t mentioned. Transfer fees (aka “Player Amortisation”), the impact of building a stadium (Interest and Depreciation) and “other costs.” “Other costs” is rather boring, although to move to the interesting part I will cover it briefly here.
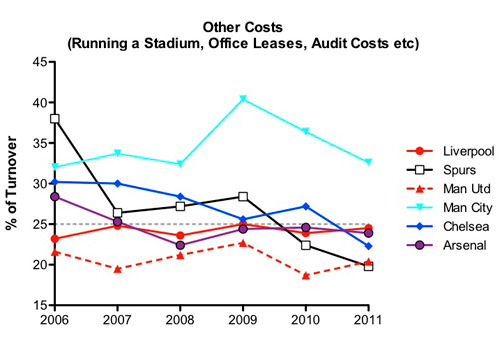
“Other costs” are actually relatively stable, except for Manchester City and Tottenham’s 2005/06 value. The average “other costs” of the top-six over six-years is about 25%. Liverpool are controlling these costs as well as other teams, though of course improvement in controlling expenditure would allow it to be directed elsewhere.
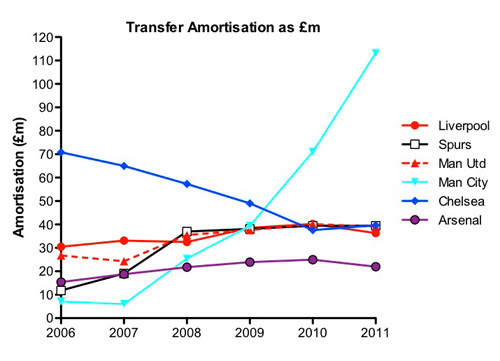
Where would this elsewhere be? Back to the “Tottenham Model”. To build a winning team it is fairly certain you will have to spend money on players. So let’s look at transfer amortisation and the interesting financial story of the rise of Tottenham to Champions League contenders.
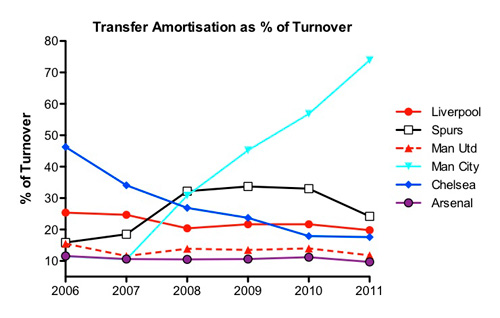 We see two clear events; Man City spending astronomical amounts on transfer amortisation and the result of Chelsea tightening the purse strings post-Mourinho. What is more surprising is a sustained spend of greater than 30% of turnover by Tottenham on transfers. Imagine the scale was not stretched by Man City and look at Tottenham again from 2008-2010. Lets look at those percentages in real monetary terms.
From 2008-2011, Tottenham were amortising player values at an almost identical scale to Liverpool, Manchester United and Chelsea, while breaking even. How did they do this? The accounts say three ways, wage control, low exceptional expenditure and high player turnover.
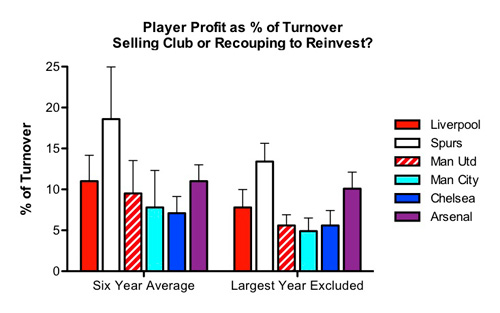 Why do I use the phrase “high player turnover” and not “selling club”? Above is the six-year average of the accounting player profit for the top-six. I have excluded the single largest year in the right hand side to remove any exceptional selling events. The six-year average for the top-six is 8%. Arsenal are labelled a selling club to fund the Emirates debt, Liverpool in 2010 and 2011 became a selling club to fund wage inflation. Tottenham gain more of their revenue – over and above basic turnover (media, commercial, match-day) – than both Arsenal and Liverpool; significantly more. They don’t use it to pay off stadium debt or wages though, they use it to sustain a highly abnormal transfer amortisation for a club which has had revenue half that of Chelsea, Arsenal and Liverpool for most of the last six years.
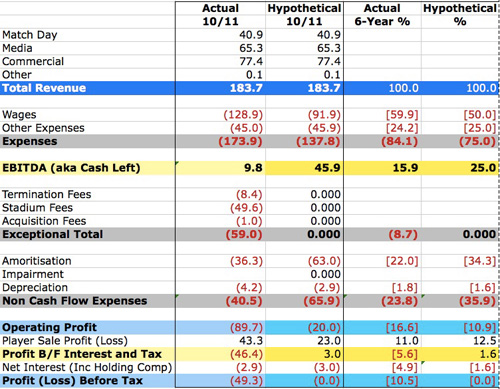
What would it look like if Liverpool adopted the Tottenham split of income and expenditure and applied it to 2011 turnover? If we assume expenditure of 25% on other costs (the top six average), 50% of turnover spent on wages, no exceptional costs, depreciation of £2.9m (the six year Liverpool average), £3m interest (the 2011 figure) and a profit on player sales of 12.5% over and above turnover (our six year average is 11%).
What I didn’t mention was the figure leftover if you put these entirely realistic values in. £63m in transfer amortisation. Scroll up to the “Transfer Amoritisation as £m” graph and look where £63m would position Liverpool on the graph. Wages of 50% gives a wage bill of £91.9m, which is ever so slightly smaller than the £96.1m wage bill from 2008/09 and is almost identical to Tottenham’s £91.1m from 2010/11 when they entered the Champions League (and saw their wage bill rocket by 36% from the pre-Champions League level of £67.1m).
To do this we have to sell players every year, I hear someone shout. Well, yes, but just the ones we don’t need anymore. With the exception of Luka Modric and Berbatov, Tottenham’s player profit came from selling players they allowed to leave knowing they had replacements, or simply wanted to move on.
Part 5 – Liverpool, Millstone-Free since 2012 (Joe Cole Excluded)
Thanks to FSG we are now entering new territory. Free from interest payments and, after some unpleasant surgery, in possession of a wage bill more in balance with other expenditure. There are two key points to think about at this juncture. Finding the best value in terms of investment for the 75% of turnover we have after other costs are covered. What does this look like? Well, a lot like walking away from Clint Dempsey.
Key to sensible investment will be wage control and investment in transfers where the probability of recouping and reinvesting from failed buys is high. Buying young and paying low wages initially means two things: a) should they turn out to be a worse player than expected they will still have a resale value (this may only be 50% of what you paid, but 50% of every failed transfer to reinvest is a lot more over the years than 0%); and b) lower wages mean prospective buying clubs can afford to match a failed buy’s wages instead of negotiating a knockdown fee just so we can remove someone from the wage bill (sound familiar?).
According to Deloitte and their football finance review covering the 2010/11 accounting period, the majority of the total commercial revenue increase of £83m in the Premier League was due to three teams, Manchester United, Manchester City and Liverpool. It is clear we are pushing this aggressively. It is also clear that apart from Champions League qualification, it is difficult to gain an advantage in terms of media income.
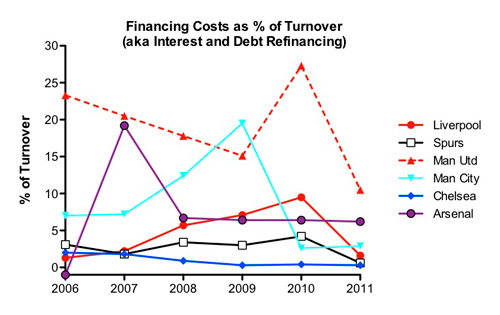
This leaves matchday income. Total Premier League matchday income only increased by £20m in total to £551m (4% rise), indicating stagnation relative to the 13% and 18% increases in broadcasting and commercial revenue respectively across the entire league. You have to ask, if it’s such a no-brainer to make money, why is it stagnant? Is it because it is a big investment for little return? Tottenham and Chelsea are also seeking to expand matchday revenue; even with a licence to print money, Chelsea are struggling. Looking at the next two graphs, we can see what Arsenal are dealing with due to the Emirates development; first financing costs, secondly depreciation.
Building a stadium gives you the twin Ds of the millstone world, debt and depreciation. Debt because you have to borrow to build it and depreciation because once it’s built it becomes a £400m+ asset with a 50-year estimated lifespan, with a decreasing value which must be written off each year. Arsenal are a self-sustaining business and as such have to break even; in fact they have to make a profit to pay off the debt on top of the interest. Feel free to scroll back up the page at the transfer amortisation graphs and look at the flat lining nature of Arsenal’s transfer amortisation.
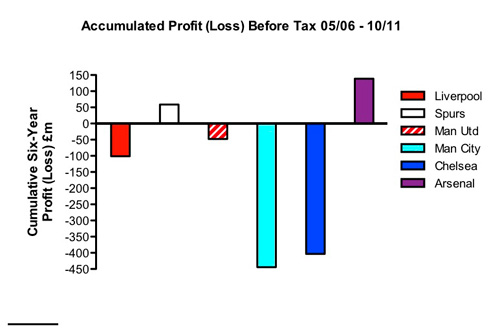 The figure above is the price of the Emirates. AFTER £89.1m of financial costs and AFTER £40m of depreciation you still have to add £138.9m of profit before tax over six-years, which instead of being spent on players was squirreled away in a bank account to safeguard Arsenal’s future against £250m of debt. Yes it’s been a financial boom in terms of the turnover generated, but how much of that has actually trickled down into the team over and above what they would have earned at Highbury?
Would Arsenal swap the Emirates for a redeveloped Highbury with its atmosphere and history? Matchday revenue is now an ever dwindling percentage of income; just how many extra percentage points does it need to be before the soulless bowl with the big brand for a name is really worth it.
In Conclusion:
I hope I have been able to show a number of things. First, a realisation of just how catastrophically wrong things went in the years ’09/10 – ’10/11. Liverpool had turned into a club who changed managers on a yearly basis, wasted vast sums on a phantom stadium which couldn’t possibly be financed, had begun the trend of decreased transfer spending and swapped it for vast ineffective wage inflation, relying on player sales to break even.
The actions of the last few years have suggested wages will go down, but they need to stay down. With that transfer spending should begin to go up and stay up. Exceptional costs should now become an actual exception. A refusal to deficit spend should also signal high levels of interest are a thing of the past. That includes not loading vast amounts of debt on the club for the vanity project of a new stadium in a world where commercial and media revenue rises inexorably.
“We will build and grow from within, buy prudently and cleverly and never again waste resources on inflated transfer fees and unrealistic wages. We have no fear of spending and competing with the very best but we will not overpay for players.
We will never place this club in the precarious position that we found it in when we took over at Anfield. This club should never again run up debts that threaten its existence.” – John W. Henry
It all seems rather obvious, you wonder why everyone doesn’t do it?
