
All data sourced from http://www.eplindex.com/stats/
Follow them on Twitter: https://twitter.com/#!/eplindex
While tearing my hair out during yesterday’s game as 28 shots resulted in just 1 deflected goal and 2 points dropped, I thought of the latest question that needs answering: how clinical are this current Liverpool team and at what point does it become a major risk to our season’s objectives? The first part of this has been relatively issue to establish and data collection took less than an hour. The second part is more difficult and I’m currently thinking about ways to demonstrate this which don’t involve a weeks worth of data collection…
Andrew Beesley, a regular contributor to this site, has already written about wasted chances from the team and an analysis of Suarez v Torres. This article is going to take a different perspective, looking at Opta’s “Clear Cut Chances” metric. Now this metric has only been in existence since 2010/11 but for me, it has a much clearer purpose than “total shots” or “shots on target”. It removes any necessity to dig into the data to look at how many shots hit the woodwork, how far out from goal they were, or whether they went “just over” or “just wide”. Assuming all Opta staff collect data in the same way (which they’re trained to do) it goes straight to the nub of the matter: there’s a clear cut chance and did it result in a goal.
The approach is simple, collect clear cut chance data by team along with the total minutes played. I’ve created the following metrics from this:
• Clinicality. Simply the conversion rate of Clear Cut Chances (CCC)
• Mins per CCC created
• Mins per CCC missed
The first table is a look at the whole Premier League this season for all 3 metrics.
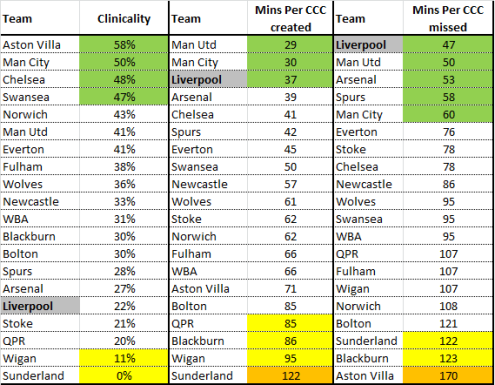
In terms of Clinicality, Liverpool are just 22% and this only ranks 16th so far this season, way behind the “big 3” who are all 40% plus. Villa are top with 58%. It’s also HALF Liverpool’s Clinicality in 2010/11 (44%) and way below the league average this season of 35%. It’s worth noting that the teams ranking 14th and 15th are Spurs and Arsenal, Liverpool’s main rivals for a top 4 place.
When it comes to Mins Per CCC Created, Liverpool rank 3rd. It’s no surprise to see the “big 6” in the top 6 positions and Liverpool compare favourably to all of them.
In terms of Mins Per CCC MISSED, the “big 6” are again in the top 6 positions but Liverpool are TOP, just ahead of United and Arsenal. Man City and particularly Chelsea are proving to be far less wasteful.
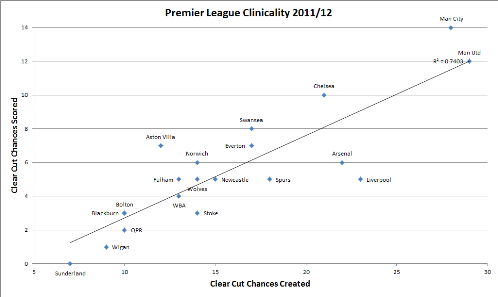
Putting this seasons Clinicality into an XY Chart illustrates the problem. Remember if you are below the line this indicates underperformance and the further below the line, the worse it is. It’s pretty clear that, as it stands, Liverpool are the least clinical side in the league.
(To view a larger image click here)
So where has it gone wrong this season? This next table shows the game by game breakdown.
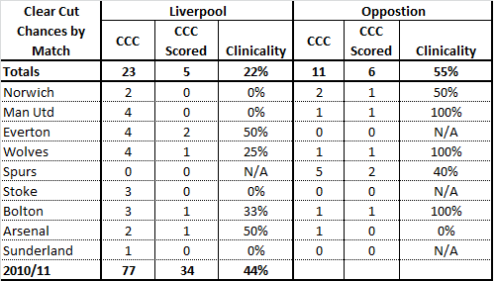
The most shocking thing is that while Liverpool are 5 from 23 (22%) in Clinicality, our opponents are 6 from 11 (55%). (Unfortunately, this data is very time consuming to collect as it’s not available on the season summary so it’s not possible to see how we compare against the rest of the league). 3 games (Man Utd, Wolves, Bolton) have seen our opponents with 1 clear cut chance, 1 goal. Norwich were 1 from 2.
With a league average of 35% and our opponents currently running at 55% it has to be noted that, statistically at least, this is highly unlikely to continue. However it does indicate a whole host of football issues for the coaching staff to address.
So who are the main underperforming culprits? This next table shows the player by player breakdown along with the 2010/11 data. Carroll at Newcastle is also included for reference.
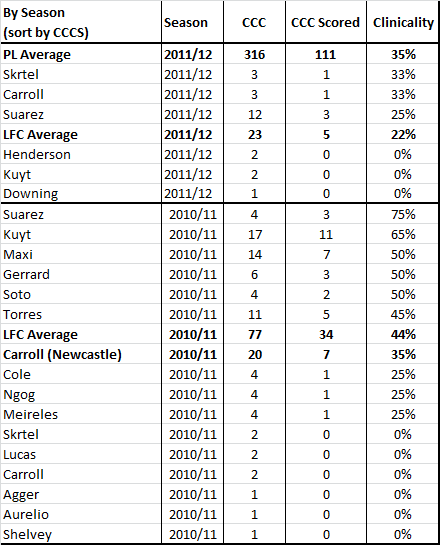
Unsurpisingly, Suarez is the main culprit with a Clinicality of just 25% which means he effectively needs 4 clear chances to score a goal. When you consider the 12 CCC he’s had represents over 50% of the team’s total, it’s no surprise that the team overall is struggling (and these stats don’t even include the missed penalty v Sunderland as Opta records penalties separately). Currently Liverpool have no-one over the league average and no-one anywhere near last season’s average. Carroll’s Newcastle stats (1 in 3) are OK but don’t suggest he would be the definitive answer to our problem but perhaps the most serious issue is that we still don’t know how clinical he can be at Liverpool with the team playing to his strengths.
Finally, with Suarez having so many CCC it’s worth looking at his match-by-match breakdown and comparing his Clinicality with other players who have over 6 CCC this season.
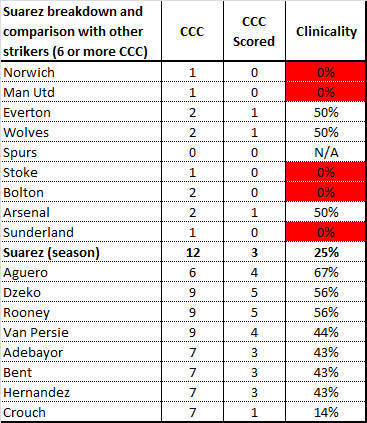
It’s clear that Liverpool as a team and Suarez as an individual have a lot of work to do to improve things otherwise the status quo will continue and dropped points will be the inevitable result. Even getting up to the Premier League average of 1 in 3 would be a significant start. To see how Liverpool perform in this regards I will be tracking over the coming months. I will also be thinking about how to answer the 2nd part of the question. All suggestions welcome!
