In football, as in life, wealth is relative. Compared with teams Liverpool are expected to finish miles ahead of, Liverpool’s squad cost and wage bill looks pretty healthy. But when compared with the teams they’re expected to compete with – and, in some people’s eyes, finish above (based not on reality but history) – then it looks less impressive.
Of course, if you looked at an unadjusted spending chart between 1992 and 2010, you would see a sharp rise, due to the increase in transfer fees over that time. After all, the English transfer record (for those buying, not selling) going into the summer of 1992 was £2.9m. It’s currently £32.5m, and bound to rise soon.
With the Transfer Price Index (TPI) project, Graeme Riley and I have sought to standardise spending across the whole era. Almost 4,500 players have been included in the data, with a yearly inflation mark calculated based on the comings and goings over each 12 month period. This means that we can compare the spending of two decades ago with the outlay of today.
(All of this work, and much more, is going towards a book on the subject, with help from members of this site, and fans/writers of each and every club to appear in the Premier League, who will check our findings for fairness and offer their own take on the findings and how it affects their team. Currently the database has over 400,000 separate fields of information.)
Perhaps of most use right now are the annual comparisons, whereby, through standardising each team’s value (therefore taking the price of someone bought ten years earlier not at its actual value, but its naturally inflated value), we can list, from 1 down to 20 (or 22 in the early years), the value of each squad.
More than this, we can narrow it down to what we call a ‘Utilisation’ tally: what each XI cost in each and every game, which allows us to calculate a seasonal average for each team.
This is (unfairly?) kind on those managers who have lots of expensive players they don’t even need to use (but whom it’s nice to have, as insurance), but we feel it’s fairer to those managers who were shorn of their best assets due to injury. It’s also fair to those managers who inherited a lot of expensive deadwood that they could neither happily play nor easily sell.
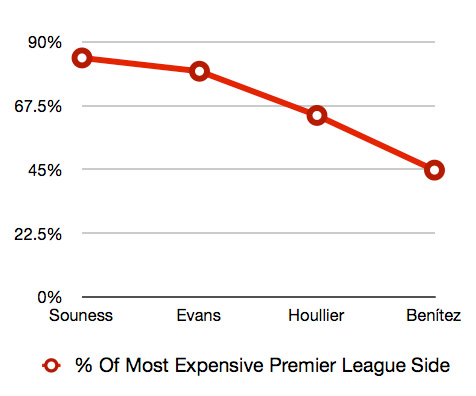
Basically, this allows us to see how well each team performed based on the cost of its starting XI. While the book will go into detail on each club, 50 major managers (everyone who has managed for three or more seasons) and list the CTPP (Current Transfer Purchase Price) values of every single player, for this piece I will deal only with the ‘big four’ (hopefully Liverpool are still included, although that’s far from certain right now), and look at four distinct periods: 1992-1994 (when Graeme Souness was in charge at Anfield); 1994-1998 (Roy Evans’ era); 1998-2004 (Houllier); and 2004-2010 (Benítez).
For comparison, the most expensive average XI from each season is ranked at 100%, and the remaining teams are calculated at a percentage of that figure. Therefore, a £100m XI average, if the most expensive, will be 100%. A £50m average for another club in the same season will be 50%. And so on.
What the following graph shows us is how, in relative terms, Liverpool have been on a gradual slide from major players to also-rans, when compared with the richest clubs of each era. The gap is widening all the time.
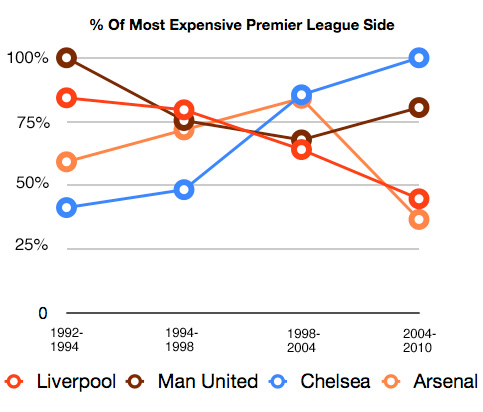
The next graph shows the other three clubs who have finished in the top four most frequently over the past six years.
While Liverpool fall away, Man United stay fairly strong (dipping in the middle period when they had the amazing youth graduates), and Chelsea, in an almost exact reversal of Liverpool’s fortunes, rise from Matthew Harding’s initial investment, through to the cash-rich Roman Abramovich years.
Of course, the graph does not include Blackburn, who ranked 100% in 1994-95, when they won the league (before it dipped, and so did they). They are the only other champions during the Premier League era.
Also, by taking a six-year average between 1998 and 2004, it does not illustrate Arsenal’s ranking between 2000 and 2003, when it ranged from between 92% and 100%, as the Invincibles were being shaped.
Indeed, Wenger’s all-important first title, in 1998, came with a 94% rating, meaning that the Gunners were within touching distance of the most expensive average side that season. Again, showing a correlation between spending and success, the following season Arsenal’s tally dropped to 77% – not because they got ‘cheaper’, but because United, with fresh additions like Jaap Stam and Dwight Yorke, got considerably more expensive (and won a treble, to boot).
But clearly, what we can see with Arsenal is that although Wenger continues to field a competitive side in terms of top-four qualification, their relative lack of spending in the past six years could be behind a failure to seriously challenge for the title; something they were doing regularly between 1998 and 2004. (We will also be taking youth graduates into account; how ‘growing your own’ affects your chances of success.)
In Liverpool’s case, it’s clear that other clubs were getting richer even before the loathed Americans arrived; indeed, that was why they were welcomed – to make Liverpool competitive again. (How long ago that all now seems.)
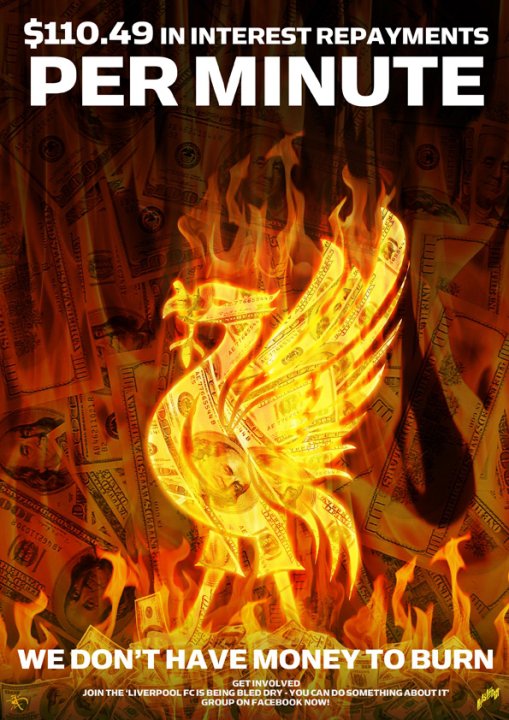
Instead, as the transfer fees of three top-class players is wasted each season on interest on debt repayments alone, the Reds are likely to continue falling away in terms of the average cost of its XI in 2010/11. No matter who is the manager, the problem of expectation outstripping reality will remain.
Our research shows some very telling patterns between spending and success, and also on the gulf between rich and poor. But more on that another time.
Liverpool Is Being Bled Dry – You Can Do Something About It
What are your thoughts on Spirit of Shankly (SOS)?
- Think their heart is the right place but slightly dubious about one or two aspects (55%, 129 Votes)
- Essential to protect fans' interests. Top organisation (21%, 49 Votes)
- Not sure what they're about, mixed messages (18%, 41 Votes)
- Find them too militant and lacking in credibility (6%, 15 Votes)
Total Voters: 234


