By Andrew Beasley (Beez).
This article was written exclusively for the new Tomkins Times book ‘They Dared To Dream: How Rodgers’ Liverpool Went So Close’, which you can purchase from Amazon here.
Brendan Rodgers forged his managerial reputation at Swansea City on the back of a possession-heavy philosophy, and it was widely expected that this approach was to be a permanent feature of his time at Anfield. Early in his tenure, the Ulsterman famously told a fansite briefing:
I’ve always enjoyed and worked with the statistic that if you can dominate the game, with the ball, you have a 79% chance of winning a game of football. If you’re better than the other team, with the ball, you’ve got an 8 out of 10 chance of winning the game.
Yet whilst Liverpool averaged 57.2% possession in Rodgers’ debut campaign, which was the third most in the division in 2012/13, his sophomore season has seen this average drop to 55.8%. As the results have been better to the tune of twenty-three points, no Kopite is going to care that their manager has seemingly abandoned his key philosophy, but how has Rodgers achieved this stratospheric improvement?
My initial assumption regarding Liverpool’s improved results in 2013/14 was that they must have had more shots than last season, and allowed fewer at the back end too.
Yet the opposite is true. The Reds have gone from averaging 19.4 shots per game down to 17.1, and from conceding 11.4 up to 12.8; last season they outshot their opponents by eight per game, but this has almost halved to 4.3 during their title challenge. Their total shots ratio (the percentage of the shots in their matches that they have had themselves) has decreased from 63% to 57% year-on-year, so we’re no closer to figuring out the root of Liverpool’s improved form here.
I wrote a piece for These Turbulent Times which looked at the importance and predictive powers of a team’s shots on target ratio (SoTR), and how it is more relevant than possession when it comes to winning football matches. As possession and the total shot ratio have decreased, my next thought was that the Reds must have had a higher SoTR than they did last season.
Yet the shots on target ratio figures are virtually identical, even down to the number of shots at each end of the pitch. In 2012/13, Liverpool had 232 shots on target and allowed 141 for a ratio of 62.2%, whilst the Reds have posted figures of 258 for and 152 against this season, for a SoTR of 62.9%. There has been an increase, but not the massive leap that you might assume in line with the vastly better results.
Historical data tells us that a SoTR of around this level should see a team in the mix for a top four place, yet Liverpool have finished seventh last season and second in this campaign. For an explanation as to why, we have to look even deeper still.
The location and the conversion percentage of shots on target hold the key to Liverpool’s impressive progress in the last twelve months. To try to assess this change, I have divided the shots on target into six areas, as you can see in this pitch map.
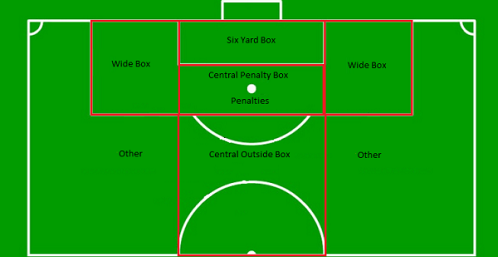
Let’s take a look at how many shots on target Liverpool have had themselves and allowed their opponents in each zone, for the last two seasons. I have excluded penalties here, as they will always obviously be from the same location.
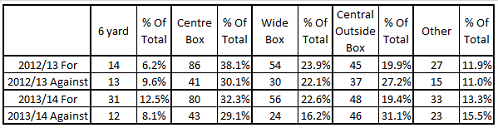
We’ll get to the conversion figures shortly, but it won’t surprise you to hear that you’re more likely to score the closer you are to goal, and to that end we can see that Liverpool have more than doubled the amount of shots on target they have had in the six yard box, whilst their opponents have essentially remained at the same level.
Most of the Reds’ improvement in the six yard box comes from having fewer in the zone directly behind that, as well as twenty-six more in total, and we can also see that their opponents have had more of their shots on target from areas outside of the penalty box, which can only have aided Simon Mignolet’s attempts to stop such efforts.
It is vital to bear in mind that score effects will definitely play a part here though. In 2012/13, on average Liverpool scored their first goal in the 34th minute, conceding first in the 46th. They lead for 1,102 minutes and trailed for 758, giving them an ‘advantage difference’ of 344 minutes.
Compare that with 2013/14: the Reds opened their scoring seven minutes earlier than in the previous campaign on average, and conceded first nine minutes later. This in turn helped them to lead for 1,826 minutes and only trail for 463, which ensured they had the advantage for 1,363 minutes in total. Over one thousand minutes more than the year before, in other words.
Teams that are losing tend to shoot more often, and usually from worse areas as desperation sets in. Equally, Liverpool will have been able to shoot from better areas when their opponents have opened up when trying to save the game. It’s key to bear this in mind; the two seasons aren’t an entirely fair like-for-like comparison for this reason.
Let’s take a look at the conversion figures.
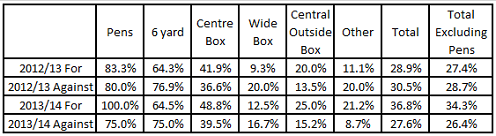
Before you say ‘you’ve made a mistake on this season’s penalties for Liverpool’, don’t forget these are shots on target; although both Sturridge and Gerrard have missed spot kicks this season, neither of them were on target so aren’t included here.
At the back end of the pitch, the figures are fairly similar across the zones, with the only major difference appearing in the ‘other’ area (though as this sees the fewest shots on target originate from it, that doesn’t make too big a difference to the overall figure). Still, any increase in the total save percentage, even if it is only 2.9% is no bad thing, and Mignolet can be pleased that he has performed better than the combined efforts of Reina and Jones in 2012/13.
It’s in the attacking areas where Liverpool have truly excelled this season. We can see in the above table that the Reds converted a higher proportion of their shots on target than in 2012/13 in all six of the zones. Their total conversion rate of 36.8% has only been bettered by six of the one hundred sides who appeared in the Premier League in the five seasons between 2008/09 and 2012/13, and is 2.4% above the club’s best performance in that period, which was unsurprisingly in 2008/09.
So to conclude, what have we learned?
Despite averaging less of the ball and fewer shots than in 2012/13, Liverpool were actually able to increase the amount of shots on target they had, and they had them from closer to goal too. Scoring earlier and defending their goal for longer (on average) undoubtedly enabled them to make the most of the effects that such positions usually have upon opposing teams.
Whilst doubling the number of penalties they won obviously helped (and arguably accounted for at least five points, with winners against Fulham and West Ham, and an equalizer against Aston Villa), the over-riding gain was made in the six yard box.
In 2012/13, goals in the six yard box accounted for just six points outright, with a winner at Upton Park accompanied by equalizers against Sunderland, Newcastle, and Chelsea twice. Yet in the last campaign, matches against Aston Villa, Manchester United, Swansea and Newcastle were all won with strikes from the closest area to goal, with further points earned away against Newcastle and West Bromwich Albion.
Hugely satisfying counter attacks were crowned with six yard box strikes too (see Sterling against Arsenal at Anfield, or Sturridge away at Cardiff) and Liverpool’s improved ability on set pieces played an enormous part as well; see Coutinho at Everton, and Skrtel against Chelsea, Arsenal and Manchester City to name but a few. Big goals in big games, no question.
Who is to say if such prowess in front of goal will be repeatable next season, but if Liverpool can open up teams as effectively as they have in this remarkable campaign, then there’s every chance that the Reds can rattle in plenty more close range goals in 2014/15.