Statistics are for league only, and correct as at 28th May 2020
If you had to describe Jürgen Klopp’s preferred style of football, you could use all kinds of different words and phrases. You might choose ‘heavy’ and ‘metal’; he would not. If you wanted to list the key attributes, again there would be all manner of aspects noted.
Perhaps the most common would be ‘pressing’. “No playmaker in the world can be as good as a good counter-pressing situation,” as Klopp once said, with his Liverpool team masters of forcing opposing teams into making costly mistakes.
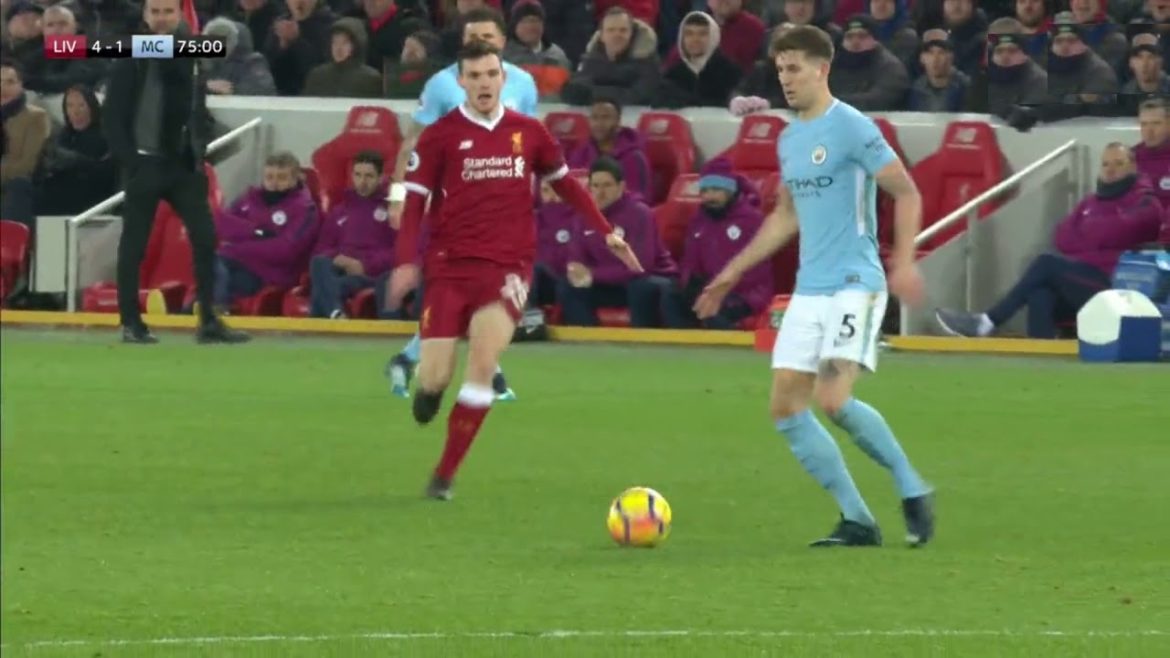
It’s a good way of impressing fans too. Andy Robertson was making just his 10th league start for the club when he went on a mazy run to pressurize Manchester City. He has been viewed as indispensable by the fans ever since.
If we want to compare pressing between leagues, teams or players though, we need to be able to measure it. Anfield Index have been collating pressing data for years, while TTT subscriber (and now Opta employee) Will Gurpinar-Morgan wrote an excellent article for this site in which he used his own pass completion model to assess pass disruption. The level of work and findings deserve immense praise.
Using our unique data, here’s a visualisation of our pressing evolution under Klopp.
Direct of play is right to left
On left is when game is level, on right when leading
Top images are 2016/17, bottom are 2019/20 #lfc pic.twitter.com/rLIHONT5qv— AIUnderPressure (@AIUnderPressure) December 19, 2019
But until recently pressing was not something that was measured far and wide, with data not widely available. Thanks to Statsbomb’s data on FBref.com, which covers the last three seasons, that has changed.
By using a different data source to the previous work mentioned, the findings will inevitably be different. However, they provide an interesting insight into how Liverpool stand above other teams, and also how the Reds’ illustrious front three press in different ways and with changing volumes over the years.
Before we continue, a quick definition of pressures. These are the “number of times applying pressure to an opposing player who is receiving, carrying or releasing the ball”, and being successful at doing this is the “number of times the squad gained possession withing five seconds of applying pressure.”
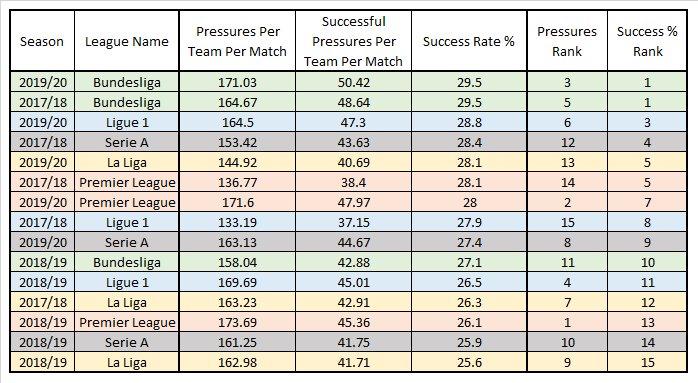
Let’s begin at league level, as the findings there are immediately of interest. When looking at Europe’s top five leagues since 2017/18, the Premier League has the top two entries for frequency of pressing, but it’s the Bundesliga which leads the way when it comes to the actual success rate of those pressures.

The good news for Liverpool is that they have been consistently above the Premier League average for the effectiveness of their pressing. However, the data here suggests that where English football as a whole often leads the way in volume, it can’t match up to Germany in efficiency. You can insert your own tired gag of choice at this point if you like, but I know you’re better than that.
The rest of this article is for subscribers only.
[ttt-subscribe-article]