By Paul Tomkins.
To read Part I: Souness, click here.
To read Part II: Evans, click here.
To read Part III: Houllier, click here.
To read Part IV: Benítez, click here.
To read Part V: 2010-2015, click here (Free Read).
During this past week I’ve looked at the transfer records of the Reds’ seven Premier League managers, including the deals done in conjunction with a Director of Football and a committee.
These articles can be found at the links above. All are for subscribers only, with the exception of the club’s most recent transfer period, 2010-2015. This piece is mostly free from the paywall, with additional analysis for subscribers only.
Introduction to the Conclusion
First of all, a brief recap on the methodology. All transfer fees were converted to 2015 money, courtesy of the Transfer Price Index (TPI) that I co-created with Graeme Riley in 2010 (which calculates ‘football inflation’, which runs at a greater rate than standard inflation). The deals were then run through a coefficient I created (TPIC), which rates transfers based on factors including fee paid, fee recouped, and the number of games played. It’s then possible to rank all 137 first-team signings that Liverpool have made since Graeme Souness took charge in 1991.
(With inflation this amounts to almost £1.8billion in 2015 money, at an average of £13m per player since 1991; however, to put that into some context, Chelsea’s spending amounts to £2.5billion since 1992 – in their case I didn’t expand it back beyond the Premier League cut-off point, which I’d done with Liverpool in order to include all of Souness’ deals. To date, Liverpool have regained 60% of their initial outlay, whereas Chelsea have recouped less than a third of theirs – in both cases obviously excluding the current squads, where no money has yet been recouped. Liverpool outspent Chelsea in the ‘90s, but have been well behind ever since. And of course, wages are another matter.)
In the conclusion to this series, I compare the records of each Liverpool manager, looking at trends in their spending and the different kinds of approach undertaken.
I look at who genuinely wasted the most money – with waste relating to a lack of money recouped on signings. Obviously every player is bought with the hope of improving the team (or, at worst, bolstering the squad), but if you can recoup 75% of what you paid on a flop then you can reinvest that in the market. If you recoup nothing, that money really is wasted. Recouping is like selling a second-hand car; not recouping anything is like pushing it over a cliff.
On top of this, I select the best XI based on the coefficient scores, and also select my personal favourite XI from the signings made – and, as if to prove the efficacy of the coefficient, it’s virtually identical. For this, and much more, read on.
Initial note: The Transfer Price Index Coefficient (TPIC) is used to assess deals. This rates transfers based on the fee paid, the fee recouped (both in adjusted for TPI inflation) and appearance data, working on the assumption that a successful transfer means that a player makes a high number of starts, or, with his talent spotted by those higher up in the food chain, is sold for a fee that (largely) represents that talent. It is not designed to be infallible – no model is – but it relies on no subjective input, and has been applied to over 2,000 deals. Remember, the deal is what’s being assessed, not the player.
The average TPIC score for a Premier League transfer is 159, and the average number of league games started by any player moving clubs is just 40.
The average percentage of games started by a transferred player is just 37% of those possible, and the average age at the time of a move is 25.6. These figures are based on 2,175 transfers between 1994 and 2014.
In terms of TPIC scores, 36% of deals rate above average (therefore have a score over +159) – which is what I round out to 40% in terms of labelling players successes. (There are a few anomalies in the lower half of the coefficient table – incredibly costly buys who were successes on the pitch, if not the bank – that would take this figure to between 40-50%.)
Only 8.8% of the 2,175 transfers score above +500 in TPIC, which I’d rate as ‘very good’ deals.
And just 1.6% of the 2,175 deals can be ranked as “outstanding”, scoring above +1,000 – that’s just 35 transfers in 20 years. Equally – or conversely – only 39 (1.8%) rank as mega-flops, scoring worse than -200.
All fees will be in 2015 money, unless otherwise stated.
Overview
First of all, it seems important to point out that Liverpool have six of the best 35 TPIC deals since 1992, whereas Chelsea and Man United have just two apiece, and Man City’s sole inclusion dates back to 2001. There is a good reason for this, and I’ll explain the wider concept of TPIC before narrowing it down to just Liverpool FC.
Remember, these are transfers on which the book is closed – they have been both bought and sold*. In City’s case, some of their signings – particularly Vincent Kompany and Pablo Zabaleta – will score +1,000 by the time they leave the club. For now, that’s not yet the case. Also, Petr Cech left Chelsea after this was compiled, and he’d go down as another +1,000 transfer for Chelsea.
(*An exception was made for the Liverpool analysis for this series, where I included unsold players but with estimated values – but they are not included in this part of the analysis, and none would yet qualify as an elite deal anyway.)
It’s indicative of Liverpool’s financial fetters over the years that only Arsenal have a greater number of +1,000 signings, with Spurs ranking third, with three. These are the three clubs that have had to buy smarter. Given that a gargantuan fee instantly makes it hard to score +1,000 points – in what is essentially a system that rates value for money as importantly as games played – this is about getting the most from more moderate buys.
And as the three clubs in question are not part of the Rich Three, they are the most prone to having their elite players poached by those at the top of the English food chain, and the top teams in Spain – and with a sale, and a big fee, comes an entry into the TPIC rankings. All three are selling clubs, to a degree; whereas United, City and Chelsea can resist most overtures for their players, if they are in contract.
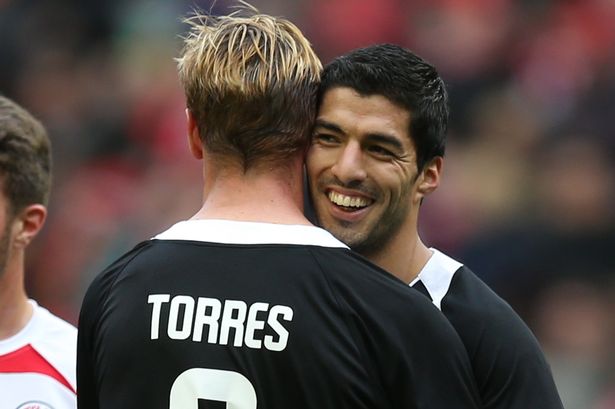
To show why really expensive players won’t qualify for a +1,000 score, the three most expensive members of the “TPIC +1,000 club” are Cristiano Ronaldo, Fernando Torres and Thierry Henry, who all cost around £40m in 2015 money at the time they joined Man United, Liverpool and Arsenal respectively; as opposed to someone like Rio Ferdinand costing United £82m. If you pay over £40m then you’re not really doing anything particularly clever; you may well invest it wisely, but it’s not going to be on anyone other than an already established major name.
Interestingly, Torres, at the age of 26 (and nearing 27), ranks as the 2nd-worst TPIC deal when moving to Chelsea for what now amounts to £72m. Liverpool were smarter when buying him at the age of 23 for £38.8m. The worst deal is also down to Chelsea: a stunning £82.9m on Shevchenko, aged 29. (My research suggests that if you buy a player aged 29, you’ll do well to get back 20% of the fee.) Both Shevchenko and Torres were released for free. To any other club this would have been catastrophic.
Chelsea also paid over £50m in today’s money for Shaun Wright-Phillips, Damien Duff, Hernan Crespo and Adrian Mutu, none of whom lived up to expectations (although Duff was pretty good, and Crespo had his moments.)
What has made Chelsea so successful since 2004 is that they have been able to pay over £50m on various other players, namely Didier Drogba, Michael Essien, Ricardo Carvalho and Eden Hazard. You might notice that from those 11 signings, only four were sensational (Essien, Drogba, Carvalho and Hazard). This fits with my theory that even if you pay big money, you’ll still be doing well to have a success rate above 50%; but success as a club comes from being rich enough to brush off costly failures.
As an aside, the top-ranked TPIC transfer is Cristiano Ronaldo, who cost United £40.4m, and was sold for an eye-popping £139.5m. That puts into context just how much £80m was in 2009. He was bought by United when young, he excelled at Old Trafford (playing a lot of games) and left for a mind-boggling fee that, somehow, has proved good value for Real Madrid.
Anyway, back to Liverpool.
Wasted Money
At this point it’s worth comparing how much each Liverpool manager recouped from their deals. Obviously the Rodgers chart relies on estimated current player value, as decided by the TTTers who answered the survey, and is to be taken as purely estimated.
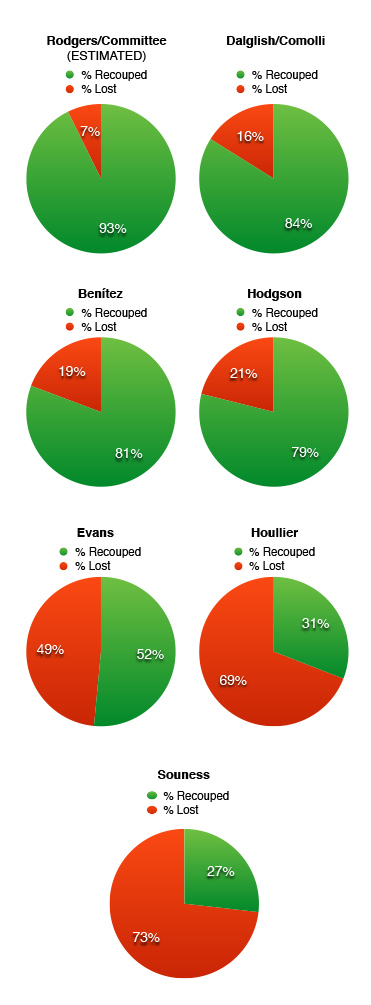
Anyone recouping under half of their spending is costing the club a lot of money. As noted before, recouping money is not the priority; ideally you’d have a player like Sami Hyypia who gives nine years of wonderful service and leaves for free. But you’ll get flops, no matter who you sign, and you’ll also get those who want to leave – and the key is to get as much money as possible in order to at least have the chance to rebuild the team.
Roy Hodgson has a very good recoup-rate, but unlike the others near the top of the chart, he had a well-below average success rate in terms of getting games out of the players.
For me, the real damage to Liverpool as a club was caused by Souness, between 1991 and 1994, followed by Evans, whose buying was mediocre (not as much money lost, but no elite signings), and then by Houllier. In that 13-year period 64% of all money spent on players was lost – after inflation, just £294.9m was recouped from an outlay of £835.8m.
That’s over half a billion pounds in today’s money that left Liverpool FC between 1991 and 2004 (in addition to wages), as if it was washed down the drain (or driven over a cliff). This approach is only okay if you can afford to do it, and it leads to major success, upon which it’s hard to put a price. However, if these signings flop, then it’s much harder to rebuild.
By contrast, from all of the buys made by Dalglish/Comolli and Benítez, just 18% was lost. Yes, it took some massive sales to recoup some of that money, but as I said in an earlier piece, you can’t ignore those that pay off handsomely, as it would be like ignoring the winning lottery ticket and only focusing on the ten tickets that didn’t win.
Dalglish/Comolli and Benítez also had less benefit from the great blossoming of homegrown talent that the ‘90s managers benefited from. They account for five of the six outstanding-rated TPIC buys Liverpool made in the Premier League era (Alonso, Torres, Reina, Sterling and Suarez, which is based on Sterling leaving this summer for £50m).
The Best LFC XIs of the Premier League Era
Here’s a quick, fun comparison – a team based on the best TPIC rankings for each position, and my own subjective ‘best’ Liverpool XI from the signings made. What’s interesting is that it reveals a deeper truth about why Liverpool haven’t won the league in 25 years – but especially why they haven’t done so in the past decade.
But before that – just look at the average ages of when these players were signed. It’s incredibly low: just 21. (Remove Sterling and it’s still below 22.)
You probably wouldn’t have wanted to field them all at that age, had they all arrived in the same summer – no one has tried fielding a Premier League team with an average age of 21 – but it goes to show how Liverpool’s best players were almost all bought young. Add that Steven Gerrard and Jamie Carragher were teenagers who came through the ranks, and you can see the value of getting players before they are global superstars. Even without the two homegrown legends, this is an XI that could have won the title.
Note: Coutinho is included based on an estimate of his transfer value.
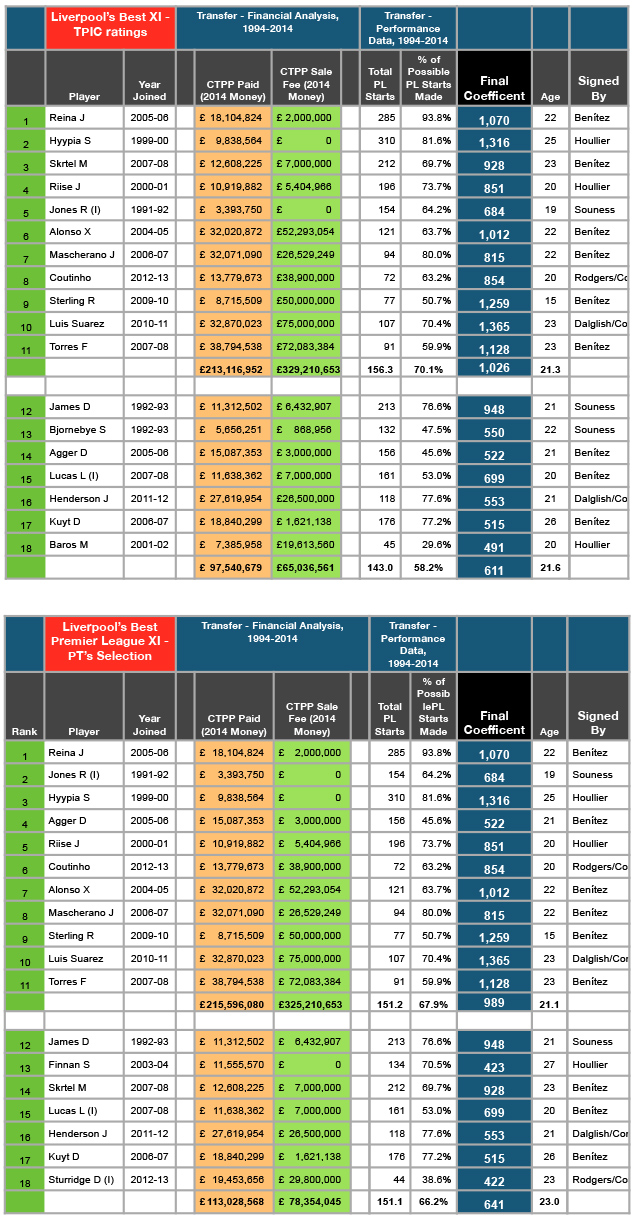
Click to enlarge. Also, I overlooked Hamann. Sorry, Didi!
The average cost of both best XIs is c.£214m. To put this into context – and explain away falling short in the league – this is much higher than any Liverpool £XI seen in any season (the £XI being the average cost of the XI over 38 games, after inflation is applied), with £145m the usual high water-mark seen in the Benítez and Rodgers eras. For either to have won the title with such inexpensive £XIs would have been unprecedented in the post-Abramovich age.
Interestingly, £214m would creep into the “Title Zone” which I’ve spoken about on many occasions – this is at least how much the £XIs of City, Chelsea and Manchester United have cost in the past 11 years when winning the title. Often it’s been much higher.
Liverpool simply never had a squad expensive enough at any one time to field a team that ranks in the Title Zone. The best players were all of title-winning quality, but they were never all at the club at the same time, partly for financial reasons. For expensive players to join, others had to leave. The same has been true of Arsenal for the past 11 years, whereas it wasn’t true before then.
The rest of this post is for subscribers only.
[ttt-subscribe-article]